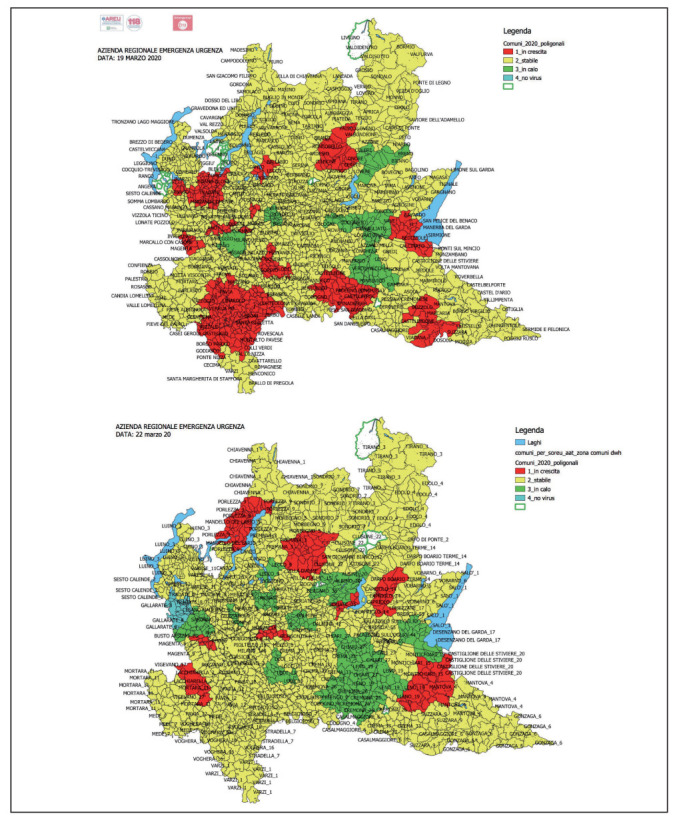
Figure 5.

Daily trend of the number of respiratory and/or infectious episodes in each pre-set group of municipalities: 19 March and 22 March

Daily trend of the number of respiratory and/or infectious episodes in each pre-set group of municipalities: 19 March and 22 March