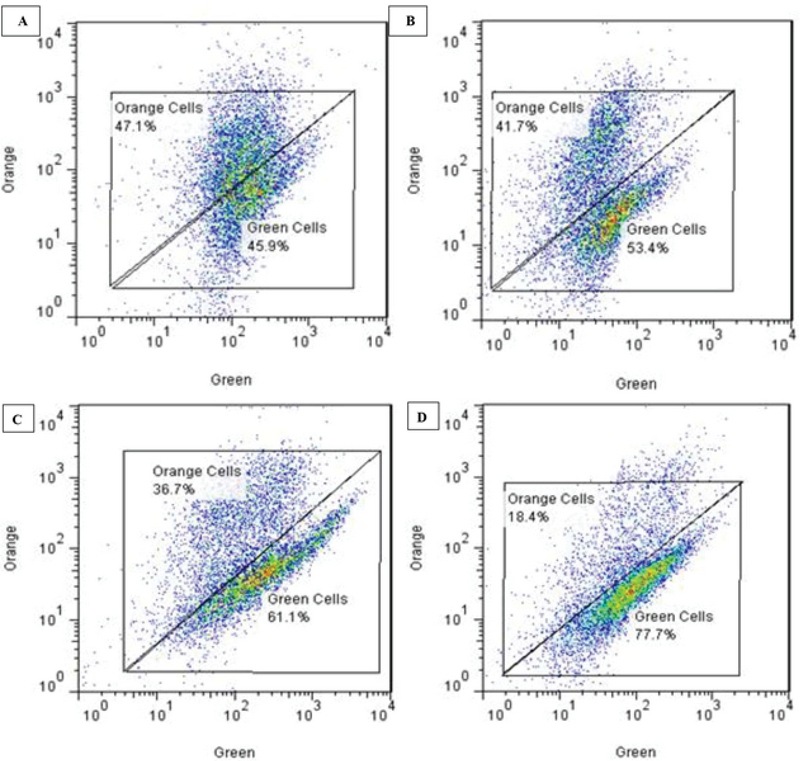
Figure 2.

Comparison of the fluorescence intensity in (a) control group; (b, c, d) groups receiving acrylamide at a doses 0.5, 1, and 2 µM, respectively.

Comparison of the fluorescence intensity in (a) control group; (b, c, d) groups receiving acrylamide at a doses 0.5, 1, and 2 µM, respectively.