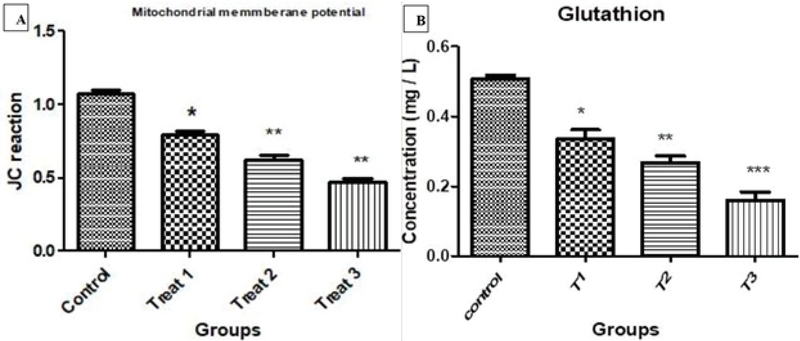
Figure 3.

Comparison of the evaluation of sperm mitochondrial membrane potential (Δ m) in groups treated with acrylamide compared to control group (A). Comparison of glutathione extraction in groups treated with acrylamide compared to control group (B). p 0. 05; p 0. 01; p 0.001; CI 95%).
