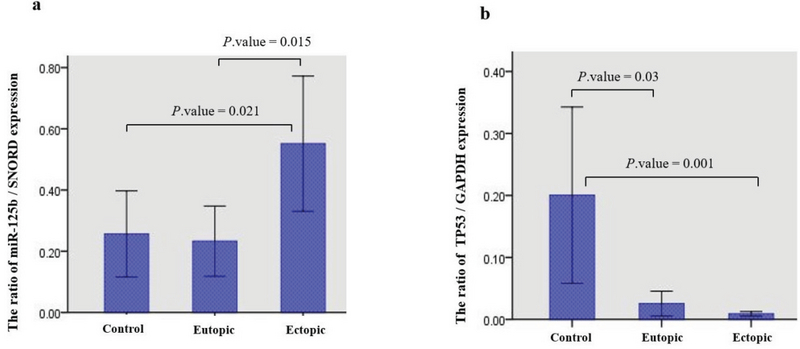
Figure 2.

Differences in expression among Eu-p, Ec-p, and Normal control samples; a) miR-125b, SNORD. b) TP53 GAPDH (Error Bars: 95% CI).

Differences in expression among Eu-p, Ec-p, and Normal control samples; a) miR-125b, SNORD. b) TP53 GAPDH (Error Bars: 95% CI).