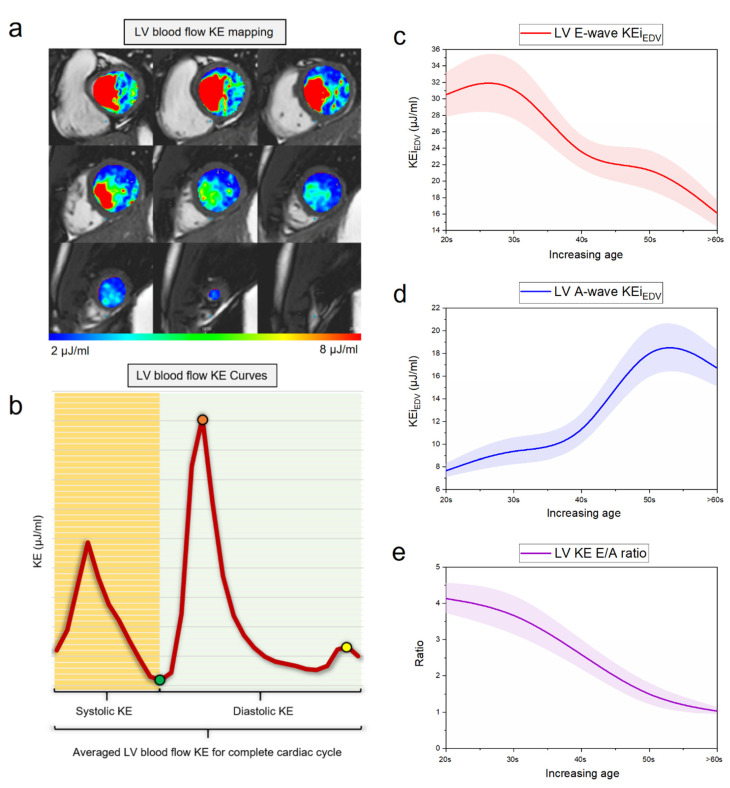
Figure 2.
Left ventricular kinetic energy (KE) mapping. (a) Mapping of left ventricular (LV) KE using endocardial contours. This is a semi-automated method for the quantification of hemodynamically relevant parameters; (b) left ventricular blood flow KE curve for the whole cardiac cycle; green point: end-systolic KE; yellow point: Peak A-wave KE; red point: Peak E-wave KE; (c) mean line of LV E-wave KE with progressive age demonstrates that with age E-wave KE reduces; (d) mean line of LV A-wave KE with progressive age demonstrates that with age E-wave KE increases; (e) mean line of LV KE ratio with progressive age demonstrates that with age KE E/A ratio reduces.

