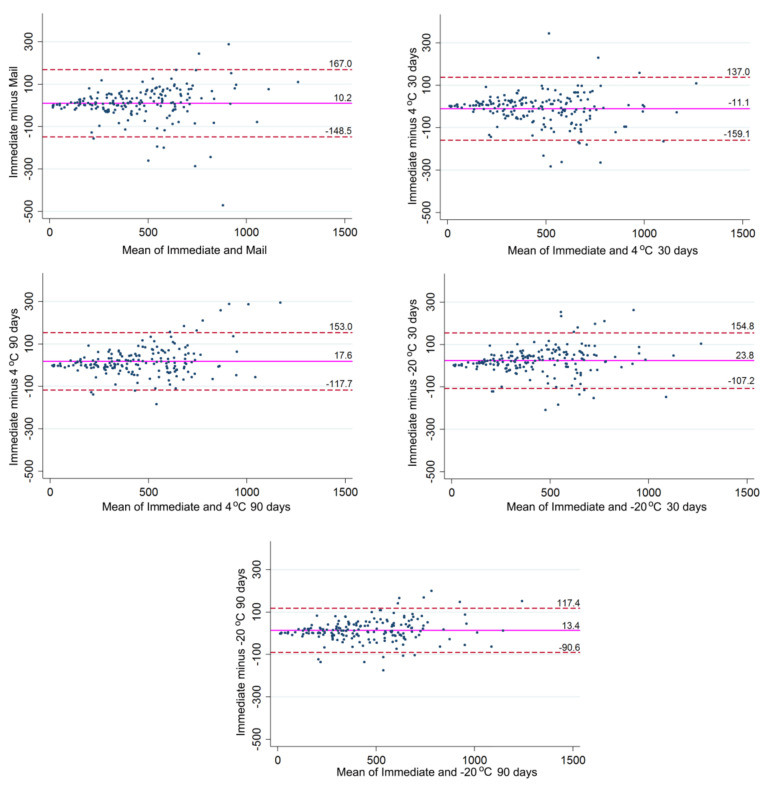
Figure 1.
Bland-Altman plots of the five different storage conditions plotted against immediate analysis after −80 °C thawing. The magenta reference line illustrates the mean disagreement; the red dashed lines state the upper and lower limits of agreement. All values are expressed in nanograms of cotinine per milliliter of sample (ng/mL).

