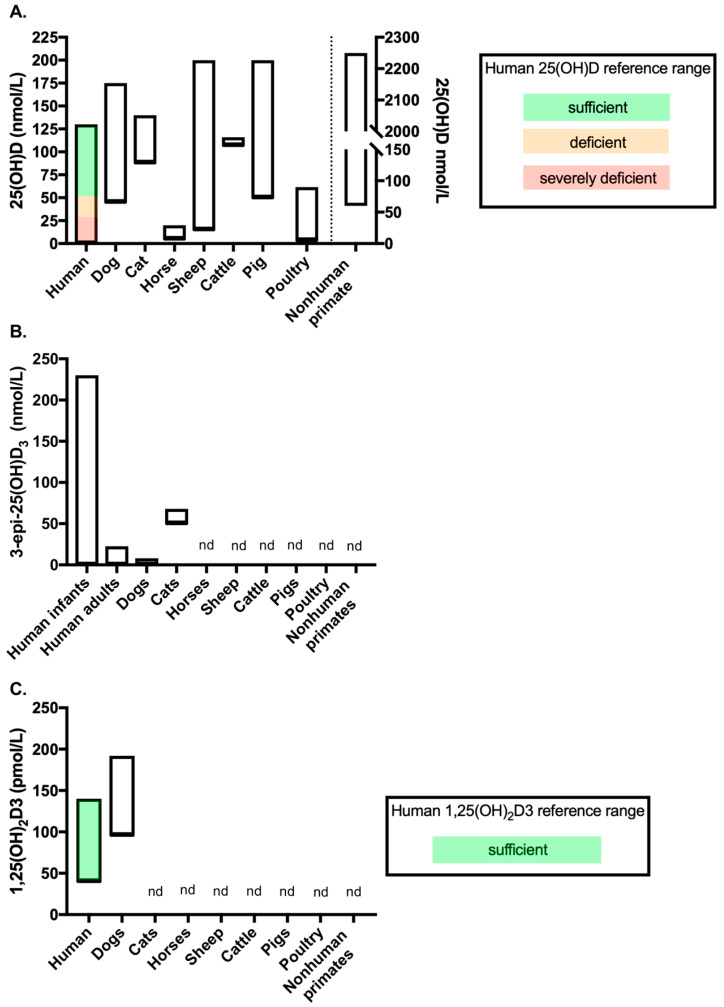
Figure 2.
Vitamin D metabolite concentrations across species measured by LC-MS/MS (data from the studies included in Table 1). Figure showing the range of (A) 25(OH)D, (B) 3-epi-25(OH)D3 and (C) 1,25(OH)2D3 concentrations measured in healthy adult controls of each species by LC-MS/MS. Where available, reference ranges are highlighted by coloured bars. The human 25(OH)D and 1,25(OH)2D3 reference ranges are from the NHS website (accessed September 2020). No reference range exists for 3-epi-25(OH)D3 in humans, therefore data from a systemic review which reported ranges from several studies was used (see Bailey et al. (2013) [79]). The number of studies included to provide data for each of the veterinary species are as follows: (A) dogs n = 8 [80,81,82,83,84,85,86,87], cats n = 1 [85], horses n = 1 [88], sheep n = 4 [30,89,90,91], cattle n = 2 [92,93], pigs n = 1 [94], poultry n = 2 [95,96] and nonhuman primates n = 2 [97,98]; (B) dogs n = 2 [81,85] and cats n = 1 [85]; and C. dogs n = 1 [83]. nd = no data available for the metabolites measured by LC-MS/MS in that species. In chart (A), data for nonhuman primates’ measures against the right-hand Y-axis.

