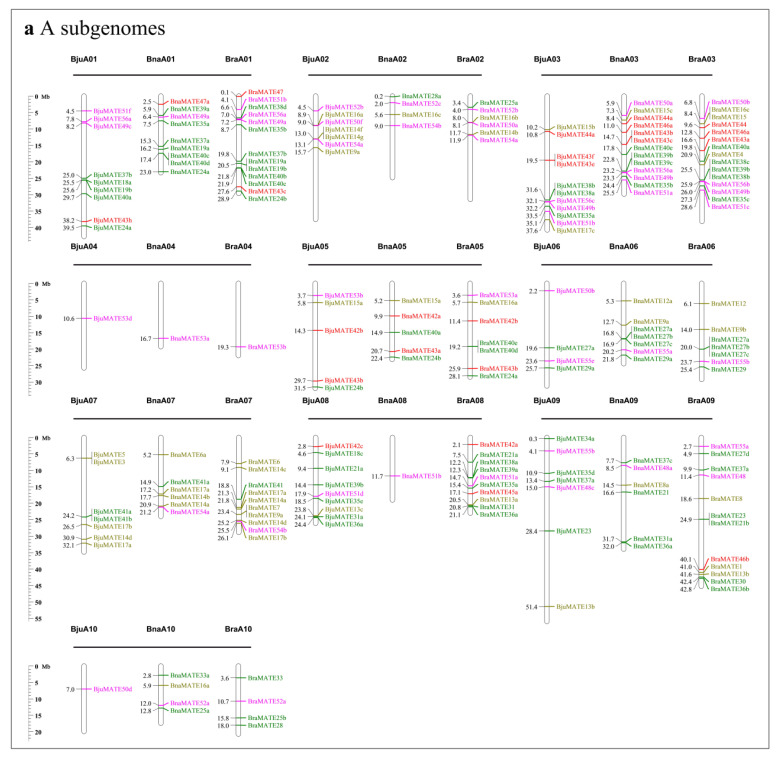
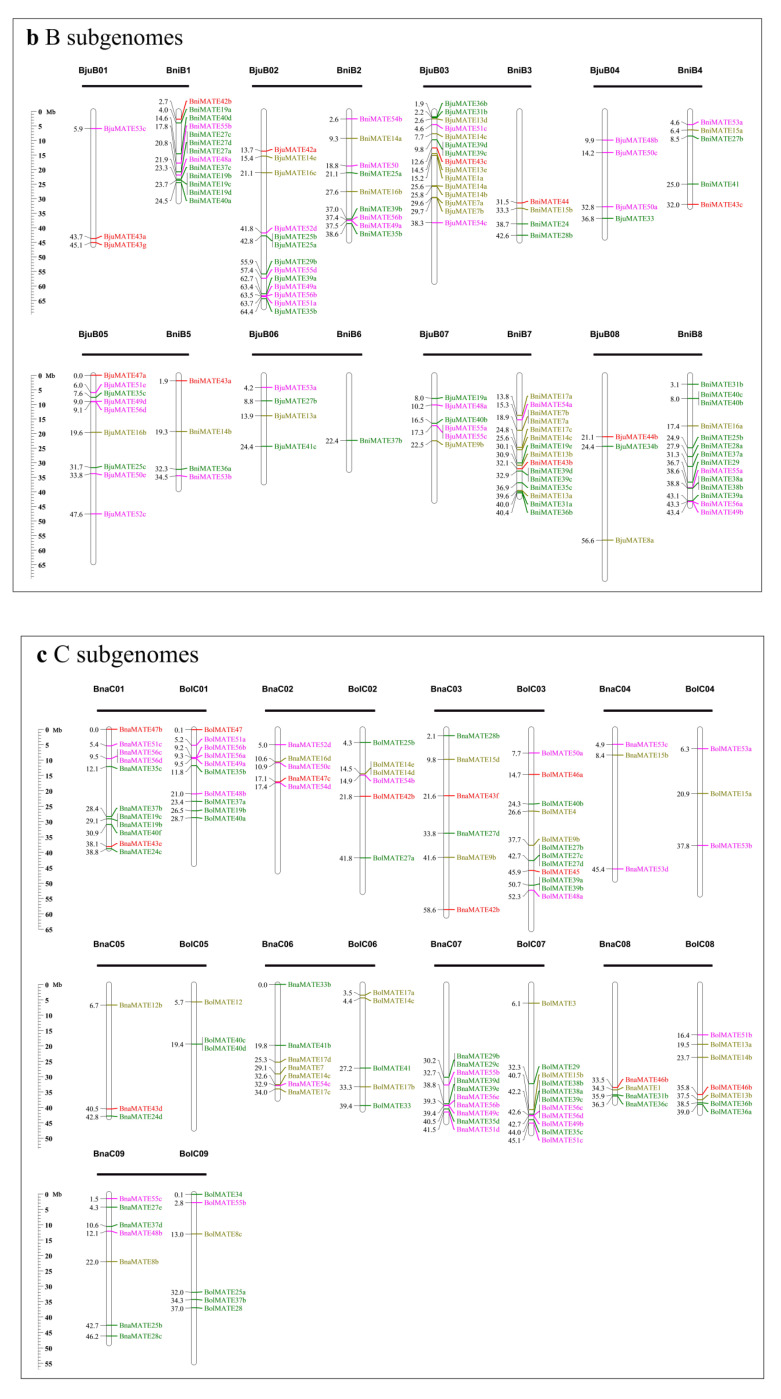
Figure 2.
Chromosomal distribution and analysis of duplication events in MATE family genes among Brassicaceae species. (a) Chromosomal distribution and analysis of duplication events in MATE family genes among A subgenome. (b) Chromosomal distribution and analysis of duplication events in MATE family genes among B subgenome. (c) Chromosomal distribution and analysis of duplication events in MATE family genes among C subgenome. Genes from the same subgroups are indicated by the same color, which is consistent with that for the corresponding family in the phylogenetic tree (Figure 1); genes located on the scaffold are not shown. The labels on the corresponding chromosomes indicate the source organism and the subgenome. The scales indicate the sizes of the various Brassica genomes (Mb). Bra, B. rapa; Bol, B. oleracea; Bni, B. nigra; Bna, B. napus; Bju, B. juncea.


