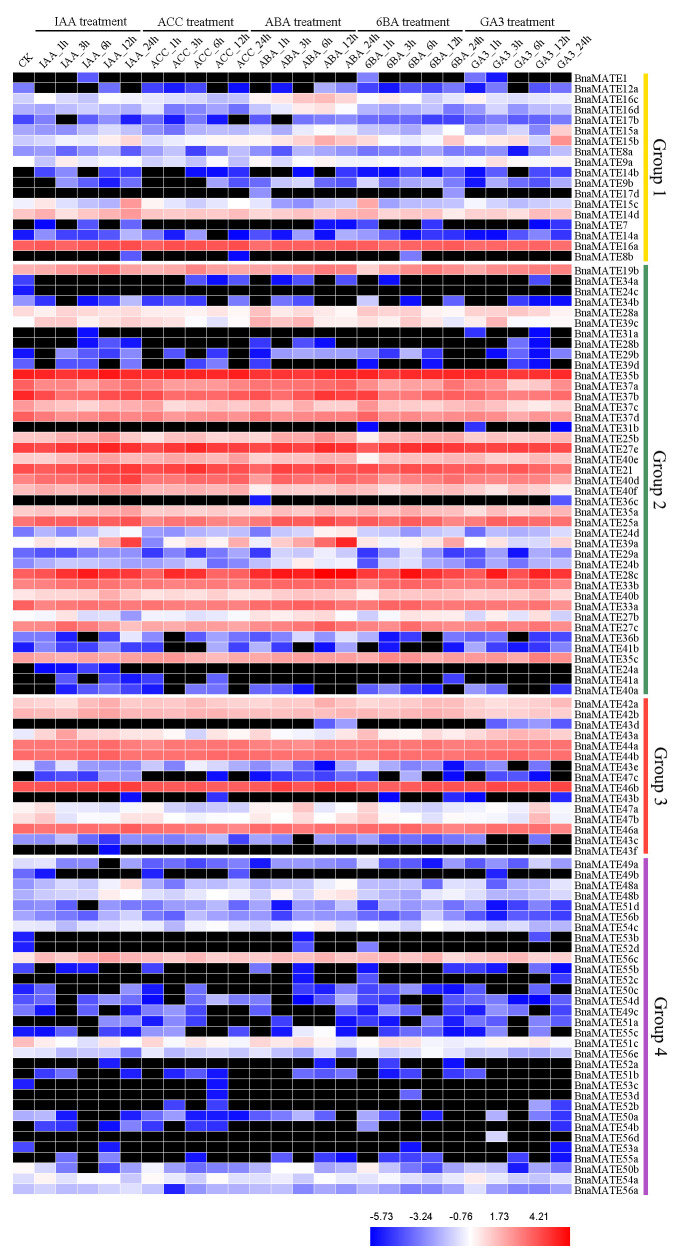
Figure 7.
Expression analysis of BnaMATE family genes under hormone treatments. The color bar represents log2 expression levels (FPKM). Red, blue, and white indicate high, low, and medium expression levels, respectively, and black indicates no expression (FPKM = 0). 18 BnaMATE genes are not shown because their expression was not detected in any condition. The abbreviations above the heatmap indicate the different hormones used to treat rapeseed plants (listed in Table S8).

