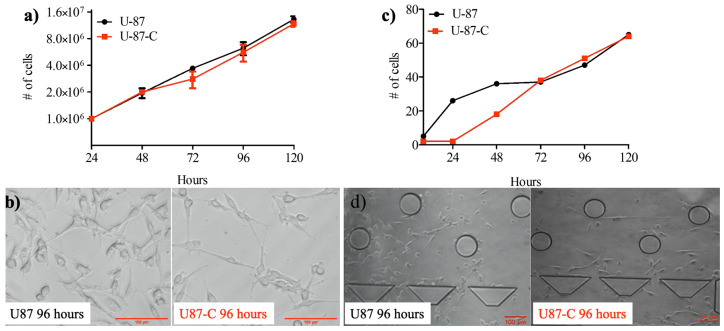
Figure 2.
Growth comparison. Glioma cells were grown in DMEM medium (U87) and in 50% DMEM and 50% macrophage-depleted medium (U87-C) in the 6-well culture dish and microfluidic platform. (a) The number of viable cells for five days in a 6-well plate, (b) the micrographs of U87 and U87-C cells for a 96-h growth. The scale bar shows 20 µm. (c) The number of viable cells for five days in the microfluidic device, (d) micrographs of glioma cells for the 96-h growth. The scale bar shows 100 µm. The number of cells present the mean ± standard error for two independent experiments.

