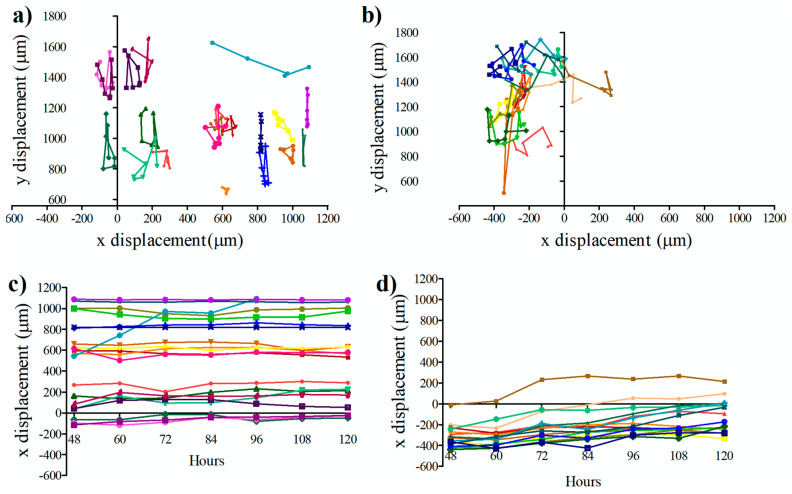
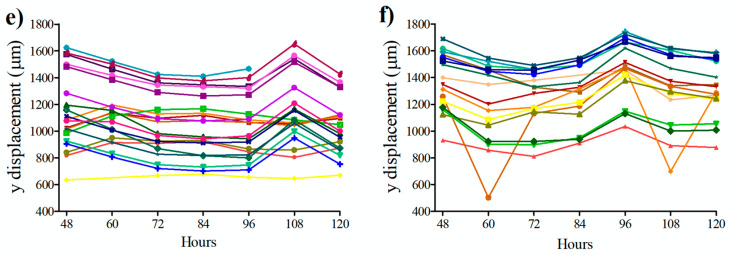
Figure 4.
Migration of single cells in the microfluidic cell culture chamber. Coordinates of the cells in the microfluidic cell culture device were measured every 12 h between 48 to 120 h. Movement of the U87 cells (a) at x-y axes (b) on the x-axis, (c) on the y-axis. Movement of the U87-C cells (d) at x-y axes, (e) on the x-axis, (f) on the y-axis. The number of analyzed cells for each group is 20. U87 indicates that cells cultured in DMEM medium, U87-C defines that cells were grown in 50% DMEM and 50% macrophage-used RPMI medium. Each color represents the single cells and color coding was consistent in each group.


