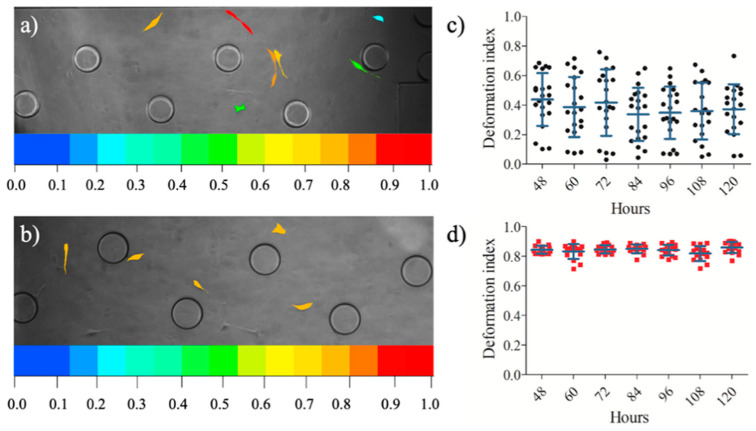
Figure 5.
Deformation indexes of the cells in the microfluidic device. The phase images of the cells with a colorimetric deformation scale, the range of deformability from coolest colors (blue: 0) to warm colors (red:1) represent enhanced deformability indexed (a) U87 population, (b) U87-C population. The deformation indexes of 20 glioma cells between 48- and 120-h (c) for U87 population, (d) for U87-C population. The data presents the mean ± standard error.

