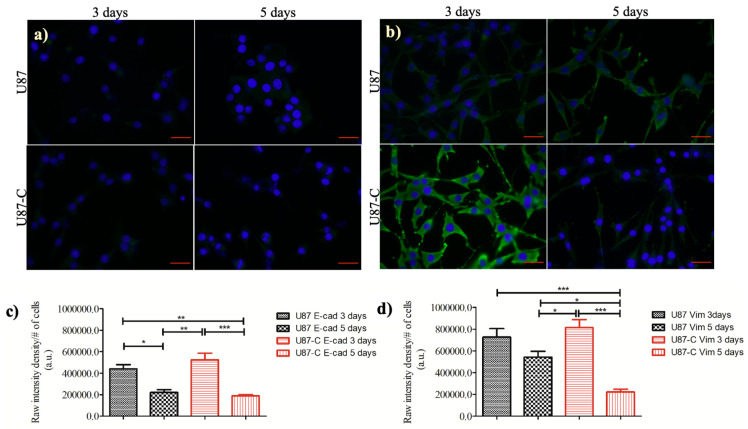
Figure 7.
Comparisons of E-cadherin and Vimentin expressions. (a) Immunofluorescence staining of E-cadherin (E-cad), (b) Vimentin (Vim) proteins (green) with nuclei counterstained (blue) by DAPI. The scale bar is 25 µm, the magnification is x63. Quantification of (c) E-cadherin and (d) Vimentin expressions of U87 and U87-C glioma cells for 3 and 5 days. The one-way analysis of variance Tukey’s multiple comparison test was applied. *, **, and *** denotes for p < 0.05, 0.01, and p < 0.0001, respectively.

