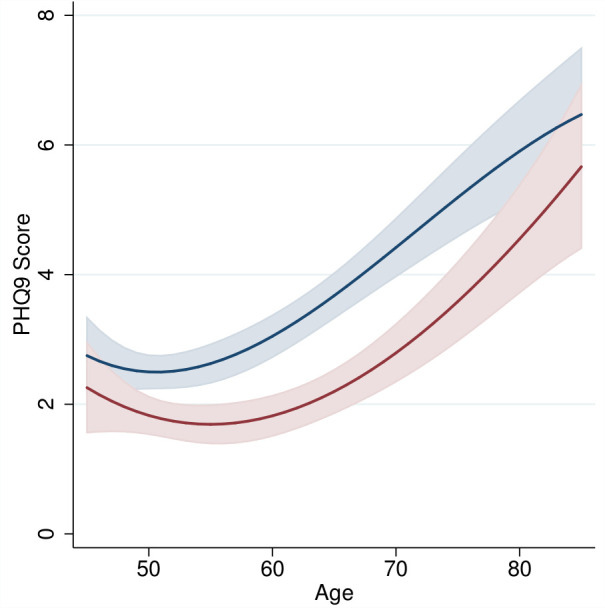
Figure 2.

Age patterns of depression (PHQ-9 score) for mature adults, 2012 to 2013. Notes: PHQ-9 depression score by age for women and men. Figure shows marginal means (with 95% CIs) obtained by regressing the respective mental health score on a cubic function of age, separately by sex. Analyses are pooled across 2012 and 2013 MLSFH-MAC surveys. CIs are adjusted for clustering within respondents. Analyses control for schooling, region and MLSFH-MAC wave. Religion is not controlled for because it is essentially collinear with region in the MLSFH-MAC; marital status is not controlled for because it is time-variant and endogenous with respect to mental health. MLSFH-MAC, Mature Adults Cohort of the Malawi Longitudinal Study of Families and Health; PHQ-9,9-item Patient Health Questionnaire.
