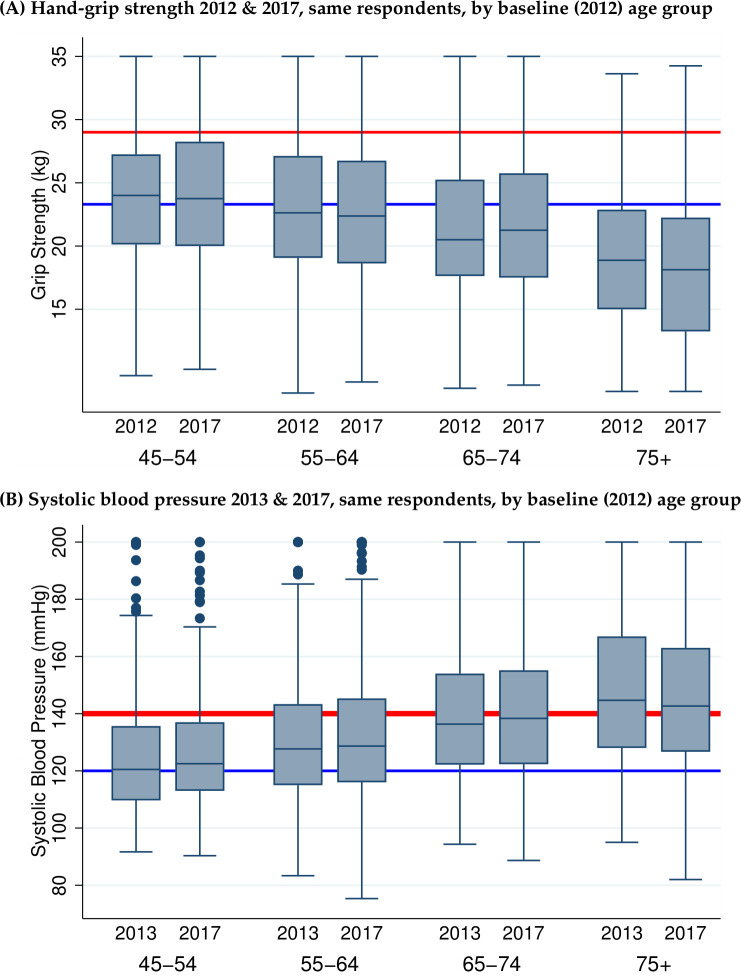
Figure 4.
Notes: Boxplots of grip strength (Panel A) and systolic blood pressure (Panel B) in the MLSFH-MAC cohort, by age in 2017. Both genders combined. Analyses include only respondents who participated in the 2012 (2013) and 2017 MLSFH MAC surveys (=surveys with the initial and most recent measures). Additional notes for top panel: Grip strength is measured in kg, combining average left and right hand, each based on 3 measurements. Red line indicates median grip strength for the US population age 55 to 64 years old estimated from the Health and Retirement Study (HRS); blue line indicates 25th percentile of grip strength for the HRS population age 55 to 64 years. Additional notes for bottom panel: Systolic blood pressure is measured in mmHG, average value based on 3 measurements. Red line indicates 140 mmHG, a common cut-off for suggesting hypertension, and blue line indicates 120 mmHG, a common cut-off suggesting pre-hypertension.

