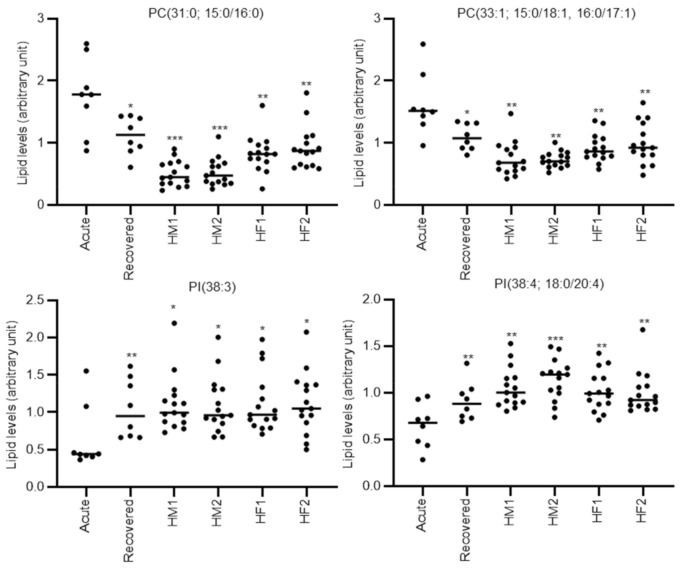
Figure 3.
Representative individual plots of lipids levels discriminating the acute phase of cholestatic-type DILI from the recovery phase and the four healthy volunteer groups. Each dot represents an individual sample. Statistical significance is indicated as follows: * p < 0.05, ** p < 0.01, *** p < 0.001. Acute; acute phase DILI patients, Recovered; recovery phase DILI patients, HM1; healthy male subject group 1 (approximately 45 years old), HM2; healthy male subject group 2 (approximately 60 years old), HF1; healthy female subject group 1 (approximately 45 years old), HF2; healthy female subject group 2 (approximately 60 years old).

