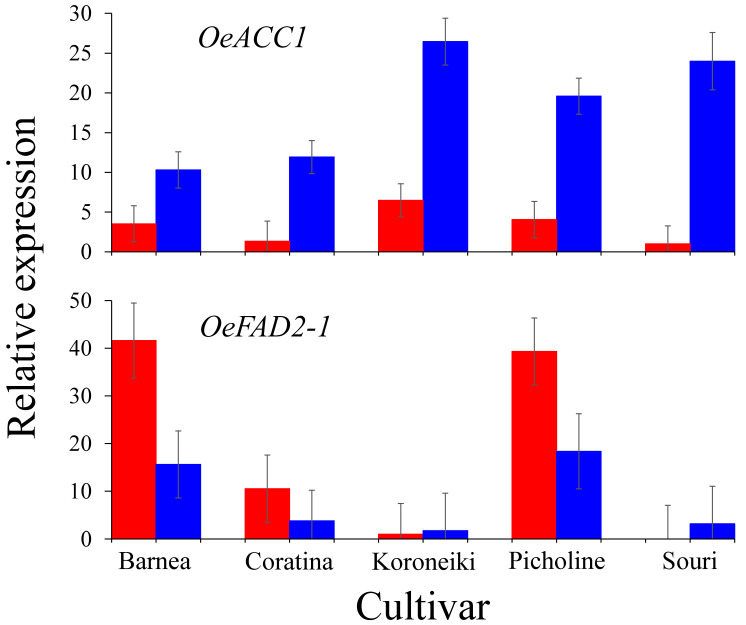
Figure 3.
OeACC1 and OeFAD2-1 expression analyzed by RT-PCR at 146 DPA. Relative expression levels of OeACC1 (above) and OeFAD2-1 (below) in the five cultivars ‘Barnea’, ‘Coratina’, ‘Koroneiki’, ‘Picholine’ and ‘Souri’, in HT (red columns) and MT (blue columns) environments. Error bars represent confidence intervals (p < 0.05).

