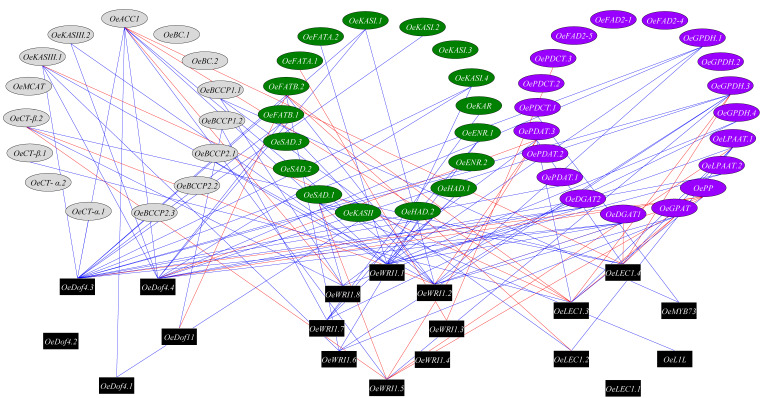
Figure 4.
TF-oil biosynthesis network. Co-expressed network of the correlation among Transcription factors (colored in black) and Oil biosynthesis genes. The blue and red lines indicate positive and negative correlations between two genes, respectively. The oil biosynthesis genes are colored in green, gray and purple for plastid, cytosol and ER, respectively.

