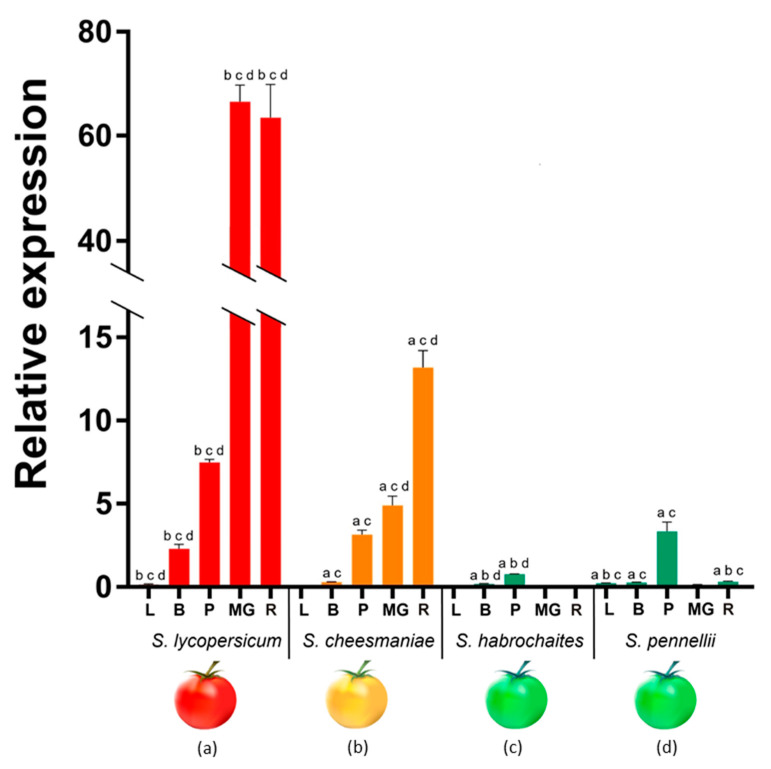
Figure 6.
PSY1 mRNA expression in leaves (L), young flower buds (B), yellow petals (P), and mature green (MG), and ripe (R) fruit of S. lycopersicum cv. Heinz 1706, S. cheesmaniae LA0421, S. habrochaites LA2144, and S. pennellii LA0716. Low-case letters above the bars indicate statistically significant differences (p-value < 0.005) between gene expression levels in the same tissue of different species: S. lycopersicum (a), S. cheesmaniae (b), S. habrochaites (c), and S. pennellii (d). For example, PSY1 expression in S. lycopersicum leaves differed significantly from those in S. cheesmaniae, S. habrochaites and S. pennellii leaves, which is, respectively, denoted by three letters “bcd” above the L-bar.

