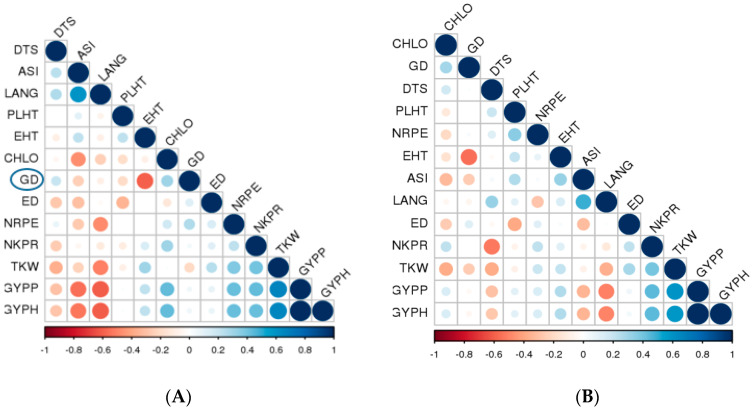
Figure 4.
Corrplot depicting correlation coefficient of genetic distance based on molecular data with F1 hybrid performance (A) and SCA (B) for all studied traits. GD: genetic distance, DTS: days to 50% silking, ASI: anthesis–silking interval, PLHT: plant height, EHT: ear height, LANG: leaf angle, CHLC: chlorophyll content, ED: ear diameter, NRPE: number of rows per ear, NKPR: number of kernels per row, TKW: thousand kernel weight, GYPP: grain yield per plant and GYPH: grain yield per hectare.

