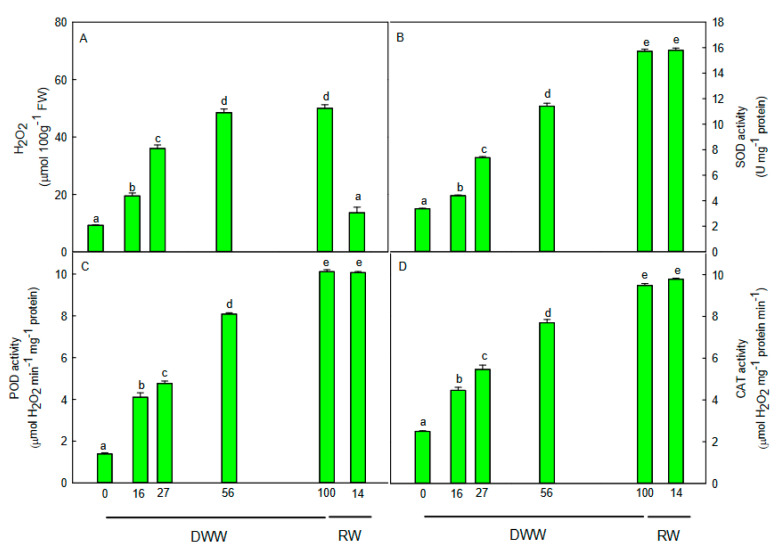
Figure 3.
Trends of (A) H2O2 content, (B) superoxide dismutase (SOD) activity, (C) peroxidase (POD) activity, and (D) catalase (CAT) activity during days without water (DWW), and rewatering (RW). Different letters indicate statistically significant differences (p ≤ 0.05) among different days. Data were analyzed by one-way ANOVA repeated measurements followed by the Tukey’s test. Data are means (n = 10) ± SE.

