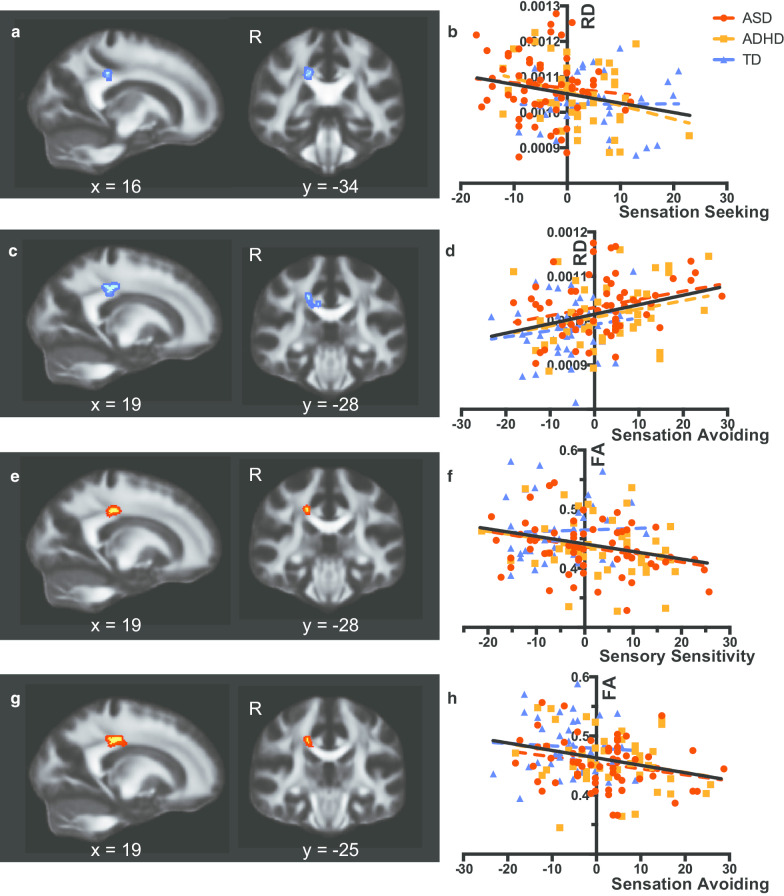
Fig. 2.
Significant voxels identified by dimensional analyses using subscale scores of the sensory profile. a Significant voxels identified by regression of radial diffusivity (RD) on the Sensation Seeking score. For the sake of visualization, the voxel clusters were thickened using the tbss_fill script implemented in FSL. b Scatterplots and regression lines showing relationships between the demeaned sensation seeking score and RD values extracted from voxels shown in a (F(1, 142) = 8.63, f2 = 0.061, P = 0.0039). Colored dotted lines indicate regression lines for the data of autism spectrum disorder (red), attention-deficit/hyperactivity disorder (orange), and typically developed participants (blue), whereas the black lines indicate regression lines for the combined data of the three groups. c Significant voxels identified by regression of RD on the Sensation Avoiding score. d Scatterplots and regression lines showing relationships between the demeaned Sensation Avoiding score and RD values. RD values were extracted from significant voxels in c (F(1, 141) = 15.17, f2 = 0.108, P < 0.001). e Significant voxels identified by regression of FA on the Sensory Sensitivity score. f Scatterplots and regression lines showing relationships between the demeaned Sensation Sensitivity score and FA values extracted from voxels shown in e (F(1, 142) = 10.70, f2 = 0.075, P = 0.001). g Significant voxels identified by regression of FA on the Sensation Avoiding score. h Scatterplots and regression lines showing relationships between the demeaned Sensation Avoiding score and FA values extracted from voxels shown in G (F(1, 141) = 11.75, f2 = 0.083, P < 0.001)

