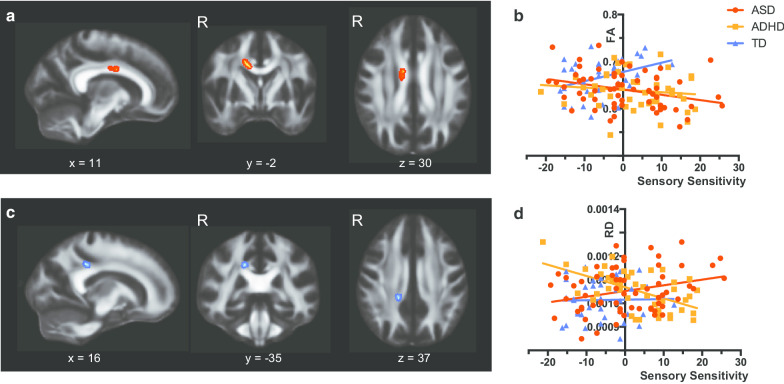
Fig. 3.
Significant voxels identified by interaction analyses of diagnosis status and subscale scores of sensory profile. a Significant voxels identified by the contrast between developmental disorders [autism spectrum disorder (ASD) and attention-deficit/hyperactivity disorder (ADHD)] and typically developed participants for the regression of fractional anisotropy (FA) on the Sensory Sensitivity score. For the sake of visualization, the voxel clusters were thickened using the tbss_fill script implemented in FSL. b Scatterplots and regression lines showing relationships between the demeaned Sensory Sensitivity score and FA values extracted from voxels in a. c Significant voxels identified by the contrast between ASD and ADHD for the regression of radial diffusivity (RD) on the Sensory Sensitivity score. d Scatterplots and regression lines showing relationships between the demeaned Sensory Sensitivity score and RD values extracted from voxels in c

