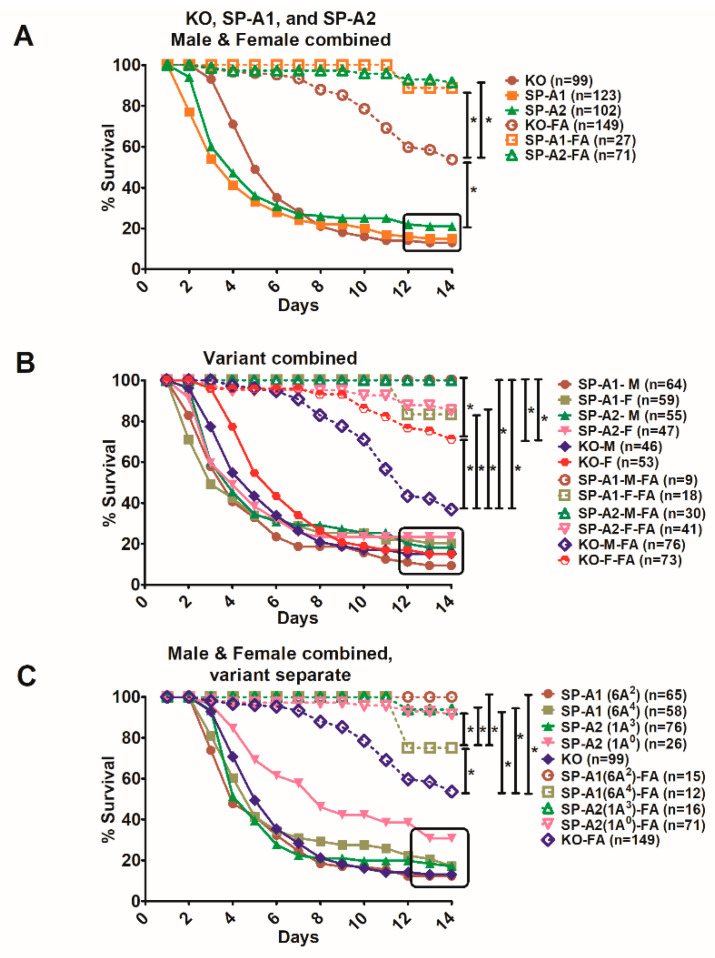
Figure 6.
Comparison of survival after K. pneumoniae infection alone and infected mice with prior FA exposure. Differences in daily survival rate of male and female mice was measured after infection or FA exposure prior to infection. Panel (A) depicts the survival curves of SP-A1, SP-A2, and KO-infected mice, and those of FA-infected mice. Panel (B) depicts survival curves for the same groups as in Panel A, but as a function of sex. Panel (C) depicts survival curves as a function of SP-A1 and SP-A2 variants. In all panels, the dotted lines with open marks depict the FA-infection and are significantly different (p < 0.05, log-rank test and one-way analysis of variance (ANOVA) followed by Bonferroni multiple comparisons correction) from infection alone (closed marks, all curves are enclosed at the 12–14-day survival by a black square). All other significant differences (p < 0.05, log-rank test and one-way analysis of variance (ANOVA) followed by Bonferroni multiple comparisons correction) are indicated by bars. The number of mice used in each group is shown in Figure panels in parenthesis (n =).

