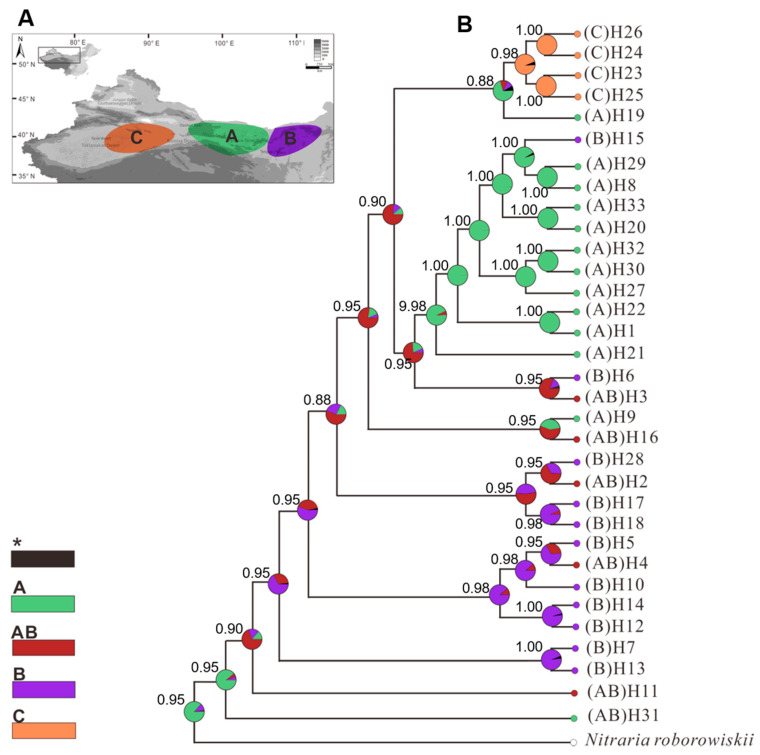
Figure 3.
Reconstruction of the ancestral distribution of Nitraria tangutorum based on chloroplast DNA (cpDNA) haplotypes as determined by reconstruct ancestral state in phylogenies (RASP) analysis. (A) Different colors represent different origin groups as shown in the map insert. (B) Results of the Bayesian Binary Markov chain Monte Carlo (MCMC) analysis. The pie chart in each node indicates the possible ancestral distribution inferred from Bayesian Binary MCMC (BBM) analysis implemented in RASP. The number above the branches indicate bootstrap support values above 80. H1-H33 represent 33 haplotypes. A, East-A group; B, East-B group; C, West group; AB, East group.

