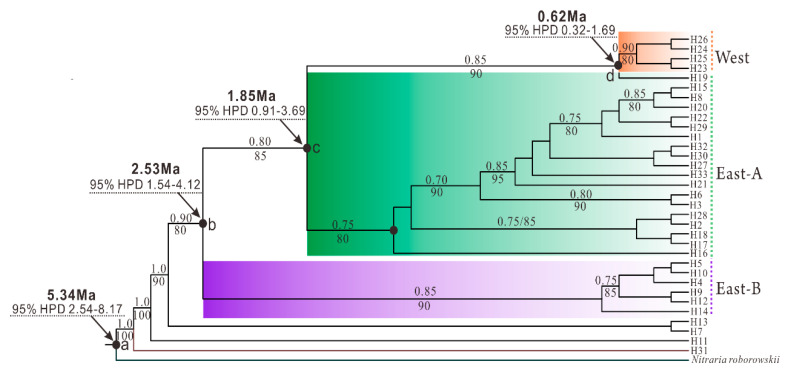
Figure 4.
Phylogenetic relationship between Nitraria tangutorum haplotypes based on the concatenated dataset of five chloroplast DNA (cpDNA) fragments. Nodes indicate mean age estimates and 95% confidence intervals. Numbers above the tree branches indicate the bootstrap values calculated using posterior probabilities using BEAST software, while numbers below the tree branches represent maximum likelihood calculated using PhyML software. The black solid circles with the points “a” to “d” indicate divergence time between two clades. HPD, 95% highest posterior density.

