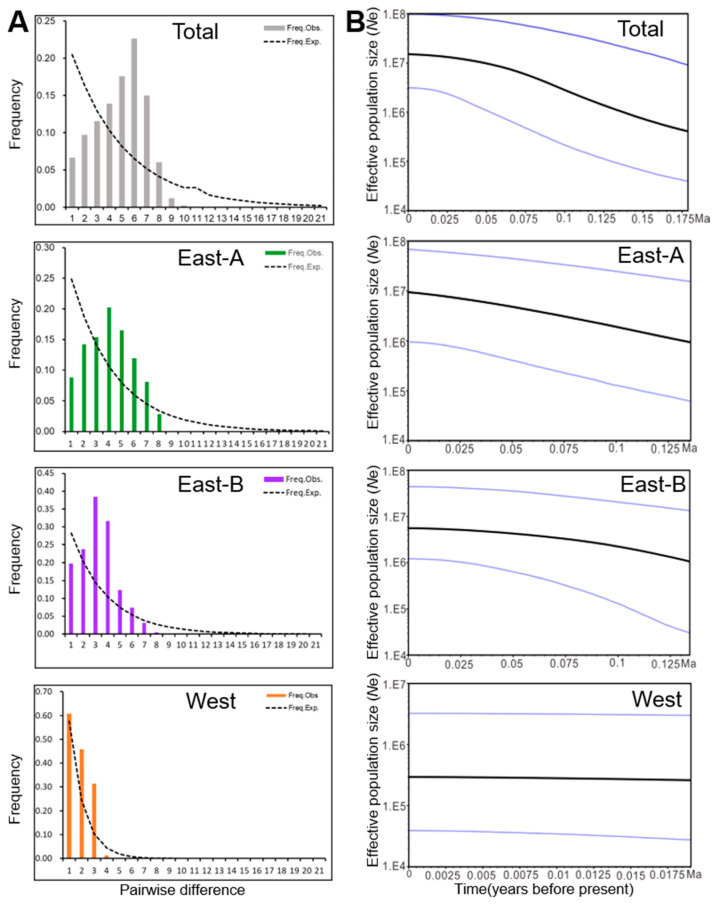
Figure 5.
Pairwise nucleotide differences and Bayesian skyline plot (BSP) analysis for the population dynamics of Nitraria tangutorum based on the chloroplast DNA sequencing data. (A) Mismatch distribution analysis (MDA) plots for the distribution frequency of pairwise nucleotide differences in total populations or within each lineage of N. tangutorum. The histogram represents the observed distribution of differences among chlorotypes, while the dashed lines illustrate simulated distributions based on a model of sudden (stepwise) demographic population expansion. Freq. obs, frequency of the observed pairwise differences; Freq. exp, frequency of the expected pairwise differences; (B) BSP analysis of effective population sizes was determined for the entire population and individual populations of N. tangutorum distributed in the East-A, East-B, and West regions. The solid line indicates the median value, and the area between both blue lines represents the boundary of the 95% central posterior density interval. X-axis: time, years before present (Ma); Y-axis, effective population size (Ne, the product of effective population size and generation length).

