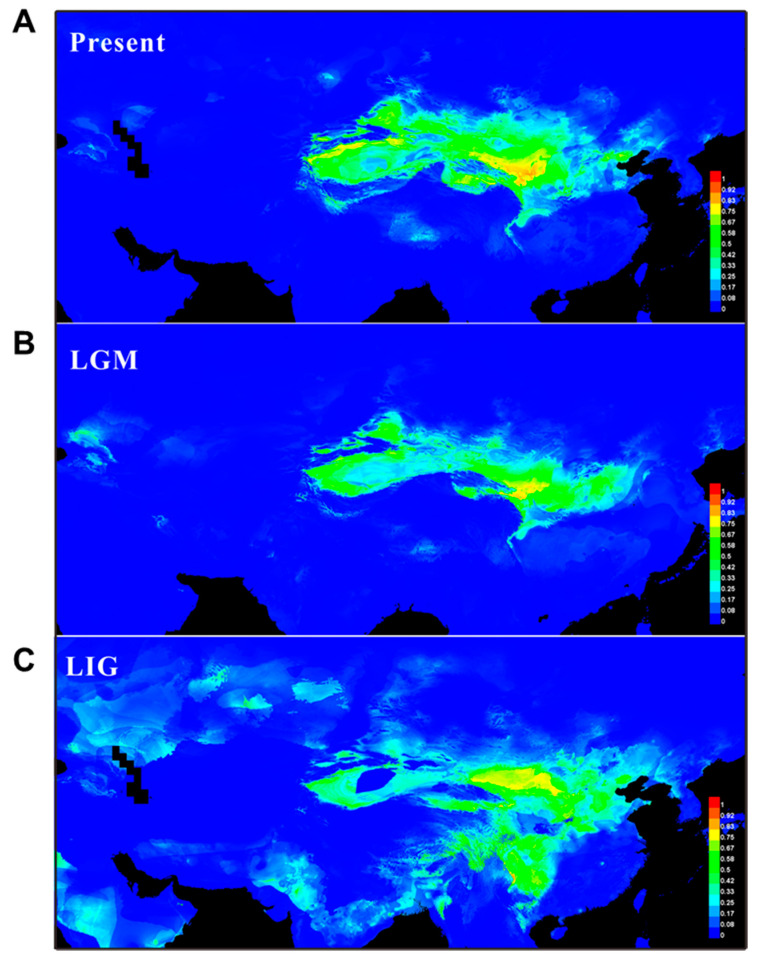
Figure 6.
Predicted distribution of Nitraria tangutorum based on ecological niche modeling (ENM) using Maxent. (A) At the Last Inter-Glacial (LIG; ~0.14–0.12 Ma); (B) At the Last Glacial Maximum (LGM; ~0.021 Ma); (C) Under current conditions (1950–2000). The color scale in range of blue to red at the right of each image represents the lowest-to-the-highest potential distribution probability of the occurrence of N. tangutorum.

