Figure 2.
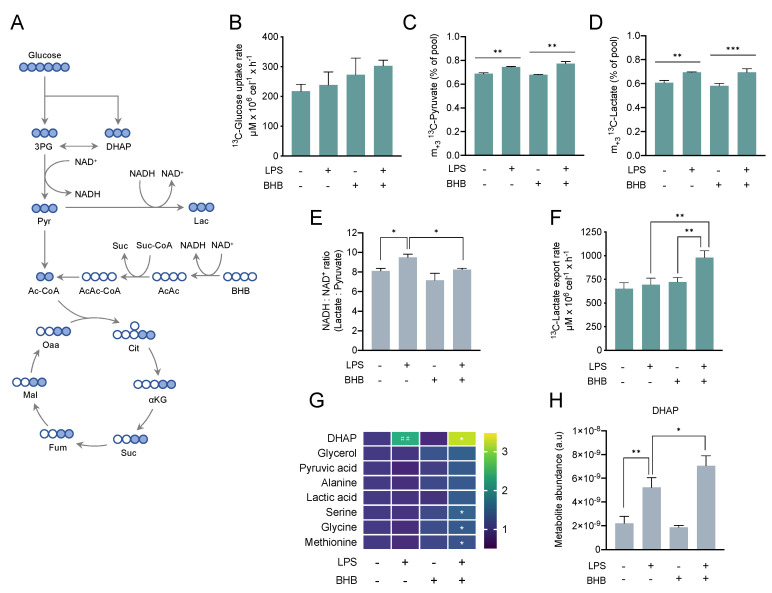
Glycolytic metabolism in response to lipopolysaccharide (LPS) and β-hydroxybutyrate (BHB) in BV2 cells. (A) Schematic representation of 13C enrichment derived from 13C6-glucose. In (B–H), cells were seeded and the next day treated with 5 mM 12C4-BHB for 24 h before the media was replaced by fresh media containing 5 mM 13C6-glucose and immediately treated with either 100 ng/mL of LPS, 5 mM of 12C4-BHB or both for 6 h. (B) 13C-glucose uptake rate in cells treated with 100 ng/mL LPS and/or 5 mM BHB for 6 h estimated by 1H-NMR. Two-way ANOVA (LPS n.s., BHB p = 0.027, LPS × BHB n.s.) followed by Tukey’s test (no statistical significance reached). (C) m+3 13C enrichment in intracellular pyruvate. Data were analysed by two-way ANOVA (LPS p < 0.0001, BHB n.s., LPS × BHB p = 0.023) followed by Tukey’s test. (D) m+3 13C enrichment in intracellular lactate. Data were analysed by two-way ANOVA (LPS p < 0.0001, BHB n.s., LPS × BHB n.s.) followed by Tukey’s test. (E) Cytosolic NADH:NAD+ ratio estimated using the intracellular levels of lactate and pyruvate. Data were analysed by two-way ANOVA (LPS p = 0.001, BHB p = 0.0021, LPS × BHB n.s.) followed by Tukey’s test. (F) 13C-lactate export rate calculated from 13C-lactate exported into media analysed by 1H-NMR. Data were analysed by two-way ANOVA (LPS p = 0.003, BHB p = 0.001, LPS × BHB p = 0.018) followed by Tukey’s test. (G) Metabolite levels normalised to untreated cells and expressed as fold-change as per colour-coded scale. Each data point represents mean of n = 3 biological replicates. Statistical significance was assessed by two-way ANOVA (DHAP: LPS p < 0.0001, BHB n.s., LPS × BHB p = 0.023; pyruvate, alanine, serine, glycine, and methionine: LPS n.s., BHB p < 0.05) followed by Tukey’s test (untreated vs. +LPS, untreated vs. +BHB, +LPS -BHB vs. +BHB +LPS). A complementary statistical analysis using Fisher’s LSD test followed by false discovery rate (FDR) correction to account for multiple comparisons both across treatment class and metabolite class can be found in Supplementary Table S3. (H) Bar chart representation of intracellular levels of DHAP. In (B–E,H), bars represent mean ± SD of n = 3 biological replicates. Statistical significance is denoted as * p < 0.05, ** p < 0.01, and *** p < 0.001 with exception of Figure 2G, where statistical significance between untreated and single treatments (untreated vs. +LPS, untreated vs. +BHB) is denoted as ## p < 0.01, and statistical significance between single treatment with LPS and double treatment (−BHB +LPS vs. +BHB +LPS) is denoted as * p < 0.05, ** p < 0.01, and *** p < 0.001.

