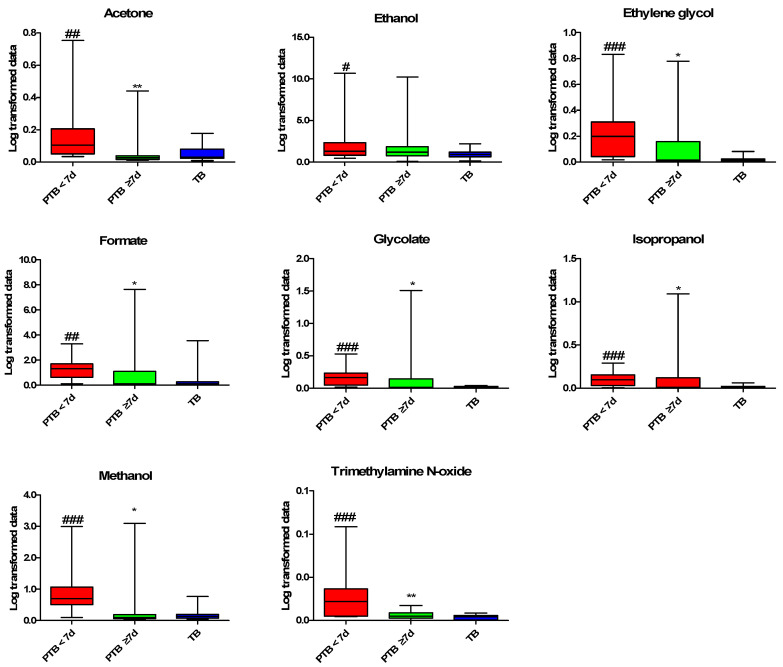
Figure 2.
Increased metabolites profiling in CVF samples. Kruskal–Wallis test was used for statistical analysis. The PQN Log-transformed data were used for graphical representation. Data are presented as the mean ± standard deviation, and p < 0.05 considered as significant. #: PTB < 7 d vs. TB; *: PTB < 7 d vs. PTB ≥ 7 d. # p < 0.05, ## p < 0.01, ### p < 0.001, * p < 0.05, ** p < 0.01. PTB: preterm birth; PTB < 7 d: preterm birth less than 7 days after CVF sampling (n = 11); PTB ≥ 7 d: preterm birth more than 7 days after CVF sampling (n = 11); and TB: term birth (n = 21). PQN: Probabilistic quotient normalization.

