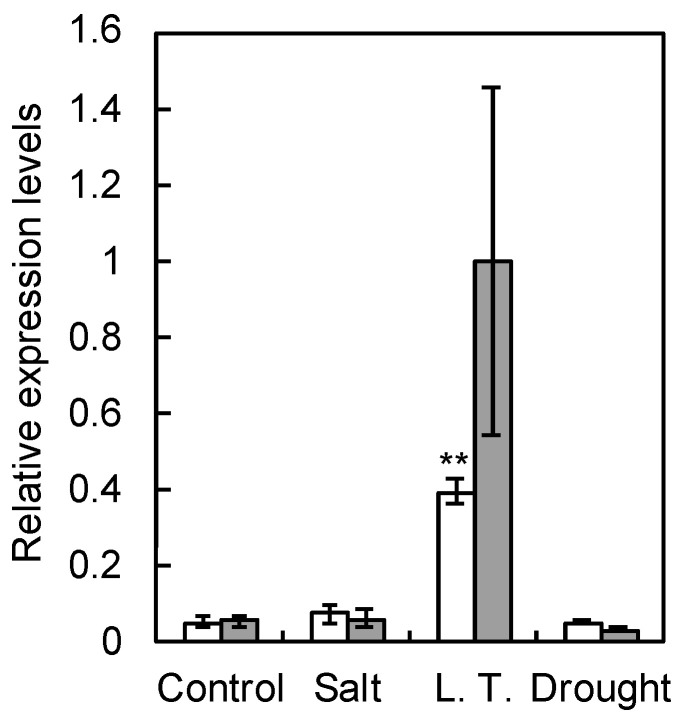
Figure 2.
mRNA expression levels of PcLEA14 in pear leaves under environmental stress conditions for 24 h (white) and 48 h (grey): data shows the relative expression levels normalized against PcrRNA. Values indicate the mean ± standard error (n = 6). ** Significantly different from control conditions at p < 0.01 according to the Dunnett’s test.

