Figure 2.
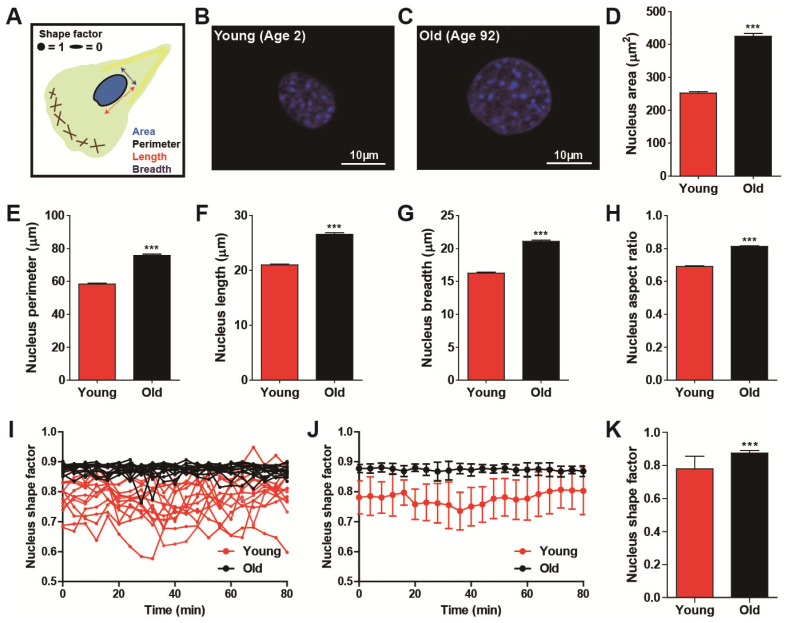
Age-dependent alteration of nuclear morphology. (A–H) Morphometric comparison of nuclear morphology between young (age < 5) and old (age > 80) HDFs. Schematic defining of descriptors of nuclear morphology (A). Note that shape factor is defined as 4π(area)/(perimeter)2, and thus, the nucleus shape factor of elongated and round nuclei approaches 0 and 1, respectively. Representative immunofluorescent images of nuclei of young and old HDFs stained with DAPI (B,C). Nuclei of young cells are smaller (D–G) and more elongated (H) than nuclei of old cells. More than 600 cells were analyzed for each condition. (I–K) Time-lapse monitoring of nuclear shape. Fluctuation of nuclear shape changes in young cells is larger than changes in nuclear shape in old cells (I,J). Nuclei were imaged using time-lapse fluorescence microscopy, every 4 min, for 80 min. Time-lapse monitoring of nucleus shape factor (I) and fluctuation of their average values (J) are presented. Average values of time-lapse monitored nuclear shape factor indicate nuclei of young cells are more elongated and they change their shape more dynamically than nuclei of old cells (K). More than 10 cells were monitored for each condition (young, 13 cells and old, 15 cells). In panels (D–H), error bars indicate S.E.M. and statistical differences were calculated using the unpaired t-test; *** p < 0.001. In panels (J) and (K), error bars indicate standard deviation (S.D.) and statistical differences were calculated using the unpaired t-test. *** p < 0.001.

