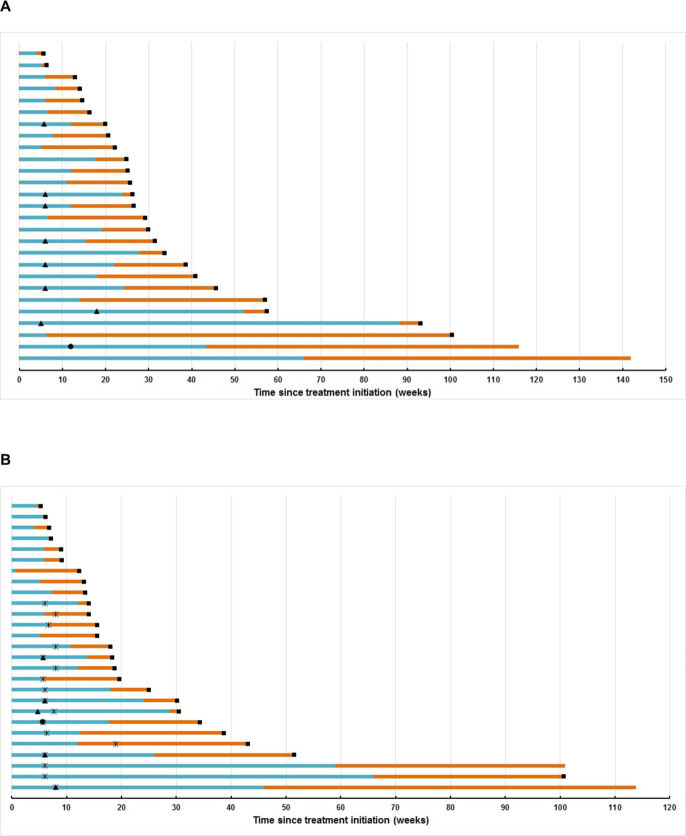
Figure 4.
Swimmer plots. (A) Swimmer plot depicting progression-free (blue) and overall survival (orange) of patients in Cohort-1 treated with avelumab and axitinib; (B) swimmer plot depicting progression-free survival (blue) and overall survival (orange) of patients in Cohort-2. Black circle denotes timepoint of complete response, black triangle denotes timepoint of partial response, black square denotes timepoint of death. The black cross denotes the start of avelumab in Cohort-2 patients.

