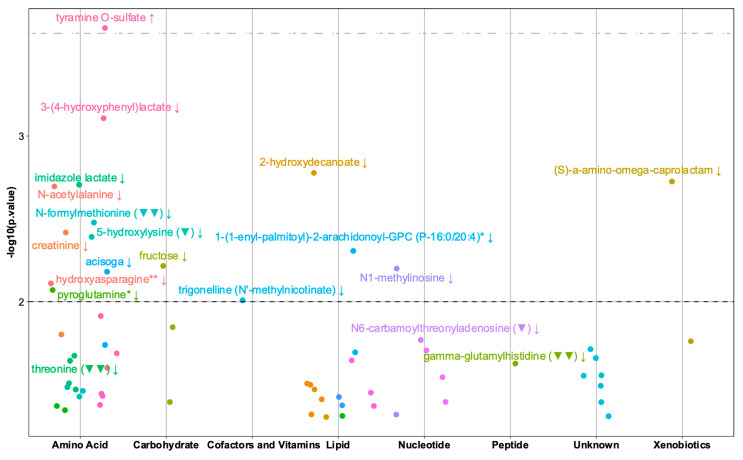
Figure 2.
Plot of the metabolites in the children at six months significantly associated with gross-motor milestone achievement. Each dot represents a metabolite grouped by super-pathway (x-axis) with associated −log10 (p-value) on the y-axis. The black dotted line represents a 0.01 p-value cut-off, whereas the grey dotted line represents a 0.25 q-value cut-off. The labelled dots are metabolites having p-value ≤ 0.01 or being also associated in the mother metabolome. The arrows represent the direction of the association with the gross-motor milestone. Metabolites in each super-pathway having the same color are from the same sub-pathway. (▼): A significant association (p ≤ 0.05) between the mother metabolite level both at w1 and child gross-motor milestone. The direction of the association is as in the child metabolome. (▼▼): A significant association (p ≤ 0.05) between the mother metabolite level both at w1 and w24 and child gross-motor milestone. The direction of the association is as in the child metabolome.

