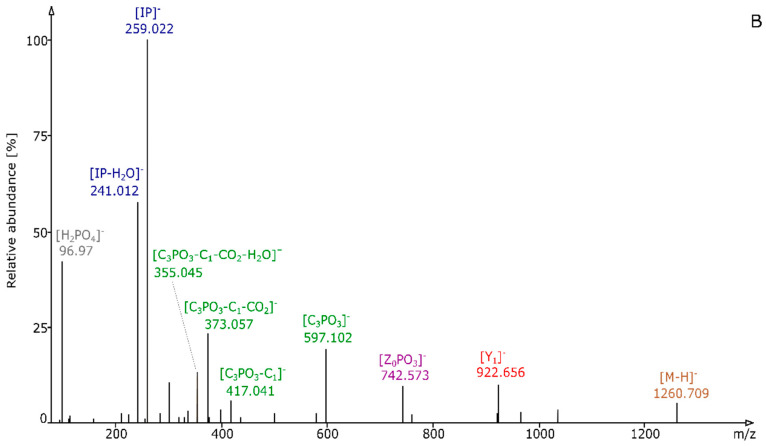
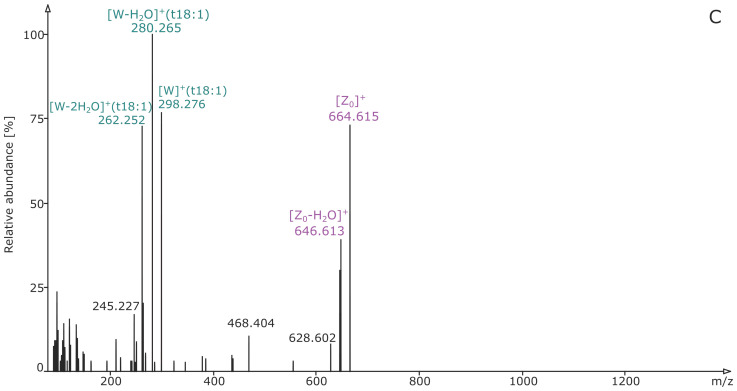
Figure 2.
Overview of the GIPC fragmentation for the example of GIPC A-OH-t18:1/h24:0 in salad: (A) The fragment assignment of GIPC A-OH-t18:1/h24:0 (adapted from [23]). The W fragment is shown in a light blue color. Please note that a full structural characterization is not possible by RP-HRMS/MS, (B) The product ion spectrum in negative ion mode at m/z 1260.7237, showing characteristic fragments m/z 241 and 259, 355, 373 and 417. The sugar head group was confirmed by the [C3PO3]− fragment (m/z 597, R1 = OH). [Z0PO3]− and [Y1-H]− fragments prove the ceramide moiety. (C) The positive ion mode ddMS2 spectrum of the [M + H]+ precursor, exhibiting the [W]+, [W-H2O]+ and [W-2H2O]+ fragments at m/z 298, 280 and 262, which are characteristic for the t18:1 LCB.


