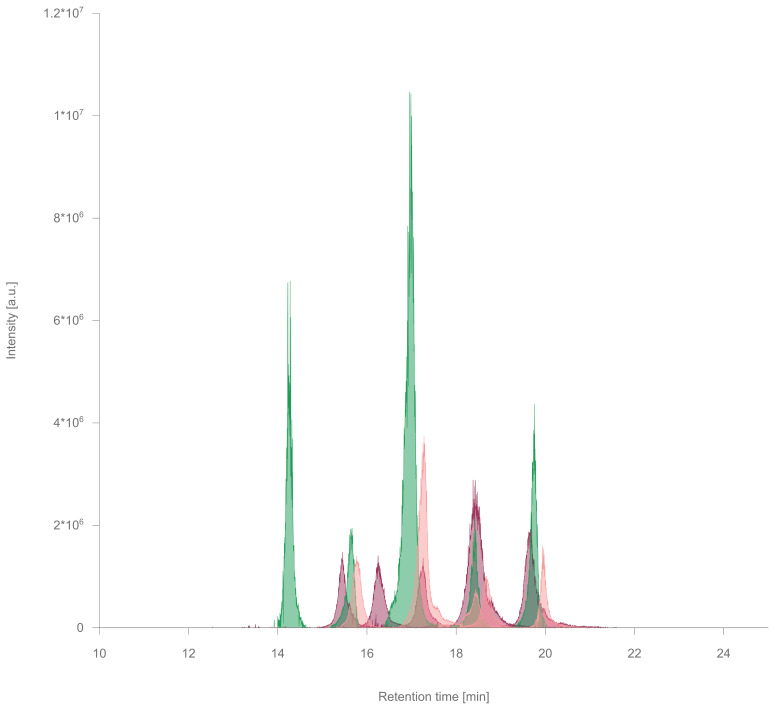
Figure A2.
Comparison of the RP-HRMS/MS GIPC profiles in spinach (green), strawberry (rose) and raspberry (dark-red), showing the five most abundant GIPCs found in each plant sample measured in positive ion mode (detailed information can be found in Table A1).

