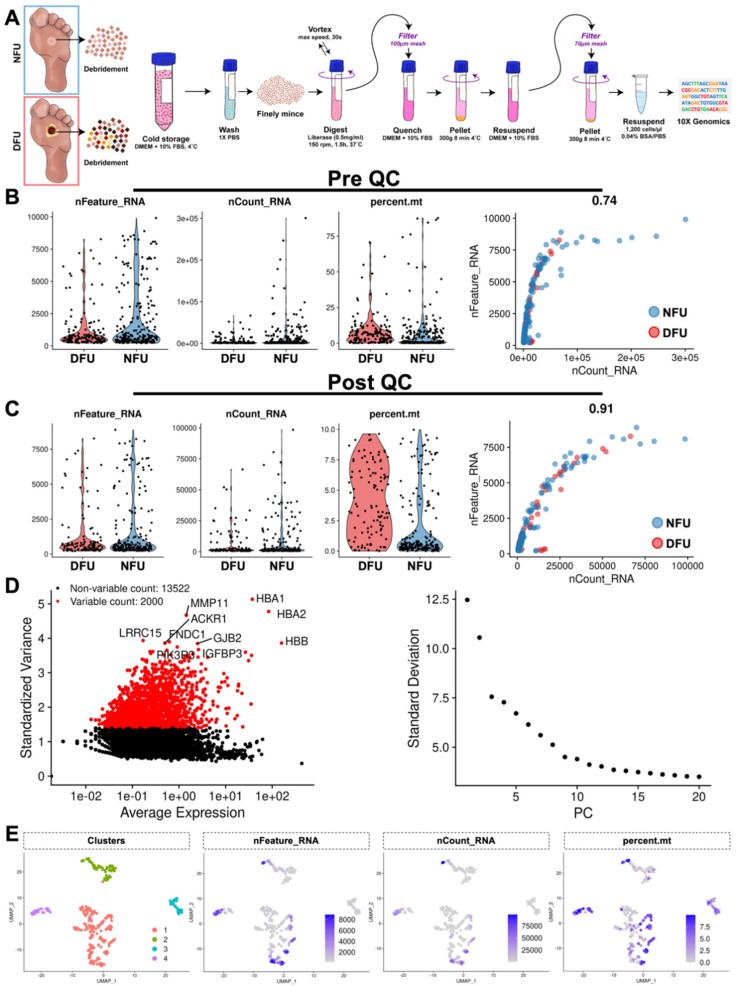
Figure 1.
Data processing and quality control. (A) Samples were collected from the wound clinic and processed into cellular suspensions for single cell RNA sequencing. (B) Each sequenced cell is plotted to show their number of RNA features (nFeature_RNA), absolute numerical count of RNA (nCount_RNA), and percent mitochondria (percent.mt). (C) Post quality control (QC) filtering of these cells. (D) Highly variable genes within this dataset are used to partition cells along 15 principal components (PC). (E) Four transcriptionally distinct subpopulations are identified, with feature plots of nFeature_RNA, nCount_RNA, and percent.mt overlaid.

