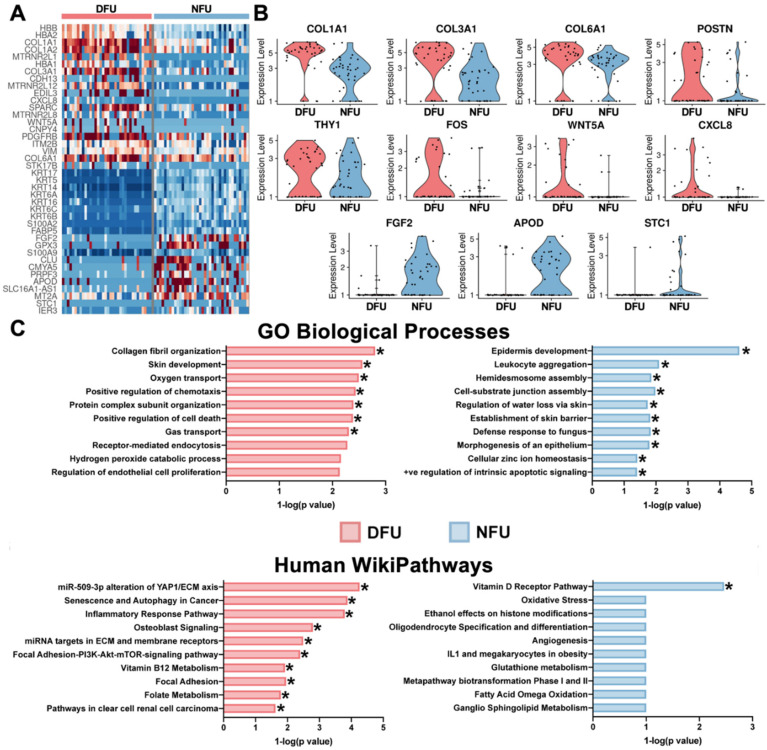
Figure 4.
Diabetic wound fibroblasts exhibit increased expression of known pro-fibrotic markers. (A) Heatmap of differential genes between DFU and NFU in the refined fibroblasts. (B) Violin plots of specific differential genes. (C) Enrichment pathway analysis using the top twenty-five genes for each group. * (p < 0.05).

