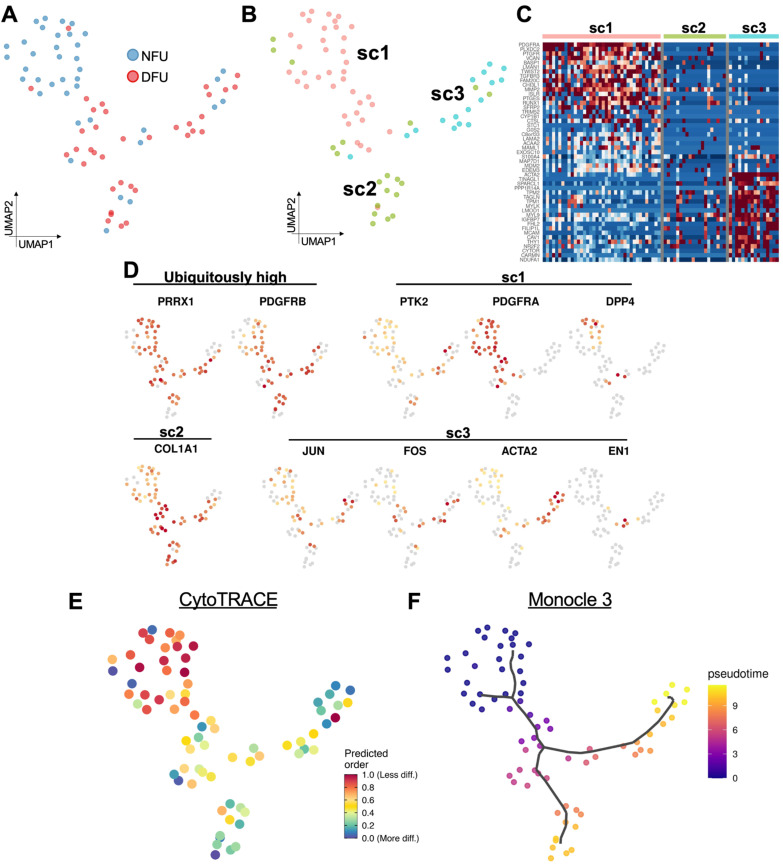
Figure 5.
Diabetes alters the distribution of fibroblast subpopulations. (A) UMAP of refined fibroblasts by experimental group. (B) Re-clustering of these cells reveals three subclusters (sc1–sc3). (C) Heatmap of differential genes between the three subclusters. (D) Feature plots of genes show fibroblast subpopulations previously characterized by our laboratory and others. (E) CytoTRACE analysis shows differentiation potential of these cells. (F) Monocle 3 pseudotime analysis shows diverging transcriptional trajectories of wound fibroblasts.

