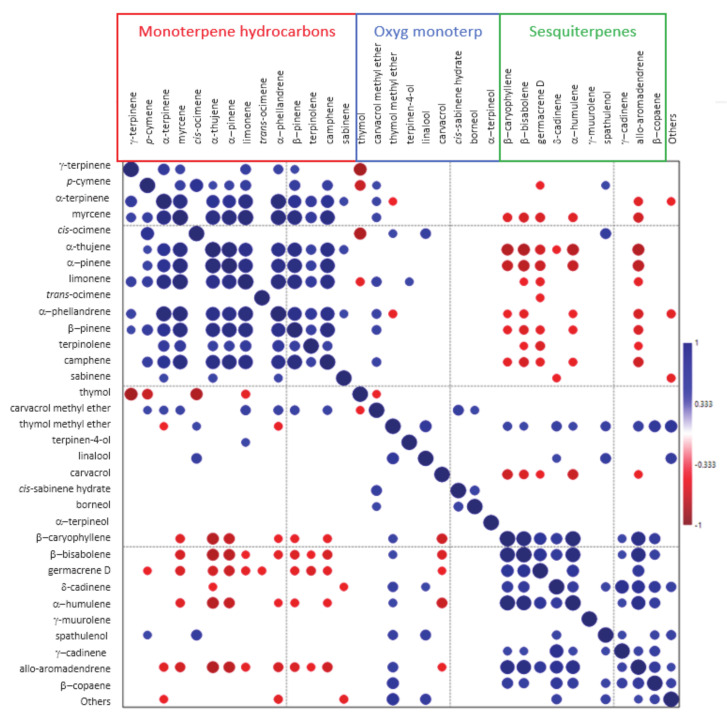
Figure 3.
Correlation (Pearson’s r) plot of the major compounds detected in EO from Origanum heracleoticum cultivated in Sicily from 2013 to 2015 in 3 locations (n = 54). Positive and negative correlations are displayed in blue and red, respectively. Size and color intensity are proportional to the correlation coefficients. r values having significance values p > 0.05 were left blank.

