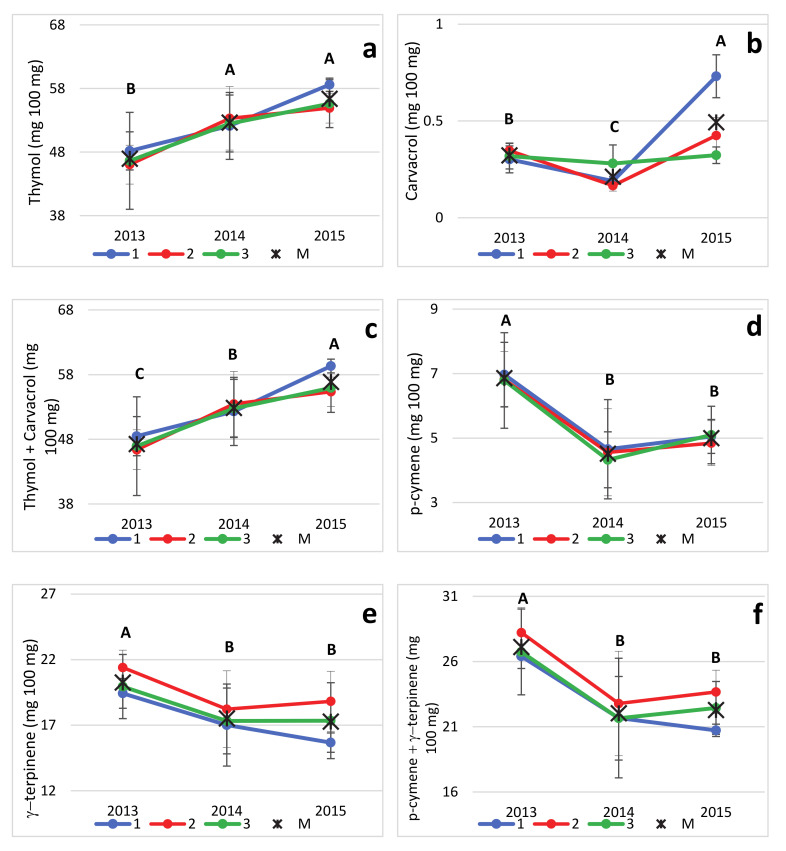
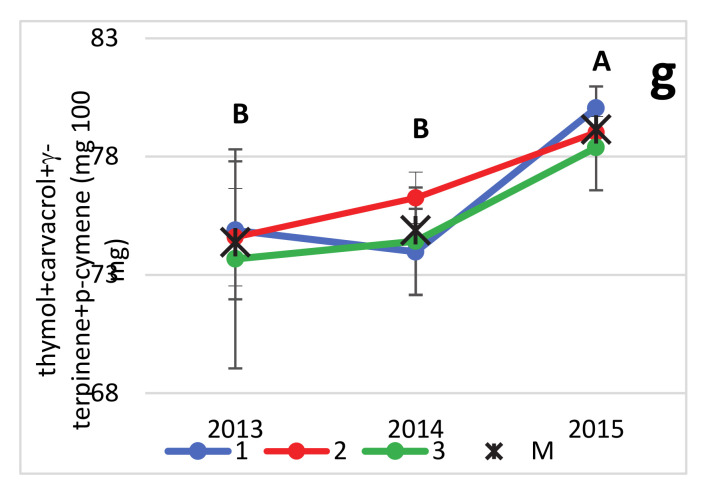
Figure 6.
Trends over the years (2013 to 2015) of percentages of thymol (a), carvacrol (b), thymol + carvacrol (c), p-cymene (d), γ-terpinene (e), p-cymene + γ-terpinene (f) and thymol + carvacrol + p-cymene + γ-terpinene (g) in the EOs of Origanum heracleoticum grown in 3 Sicilian locations (1, 2 and 3). Within each graph, an asterisk (*) indicates the mean year value, and the letters above, when different, indicate significant differences among years at p ≤ 0.05 (Tukey’s test).


