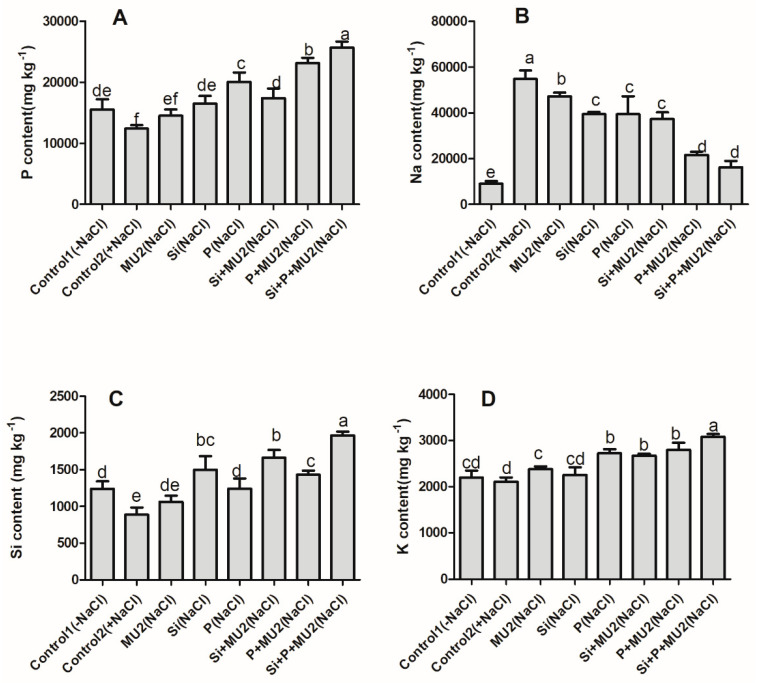
Figure 3.
Concentration of different elements in soybean plants following the inoculation of P. koreensis MU2 under salt-stress conditions: (A) Phosphorus (P); (B) Sodium (Na); (C) Silicon (Si); (D) Potassium (K). Each data point represents the mean of at least three replicates. Error bars represent standard deviations. Bars with different letters are significantly different from each other at p ≤ 0.05.

