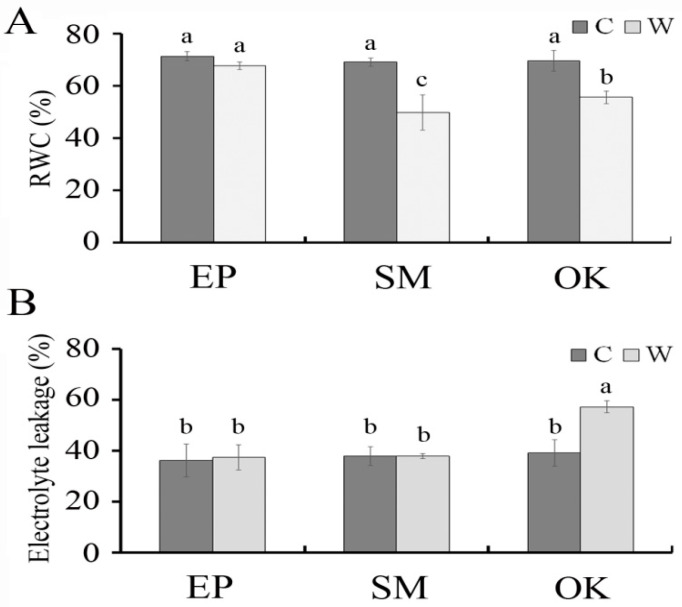
Figure 2.
Effects of waterlogging on (A) relative water content (RWC, %) and (B) electrolyte leakage (EL, %) in EP, SM, and OK plants. Plants were grown under optimally irrigated (control, C, black bars) or waterlogging (W, white bars) conditions for 13 days. Means followed by different letters are significantly different at p ≤ 0.05 by least significant difference (LSD). Vertical bars indicate the standard error (n = 4).

