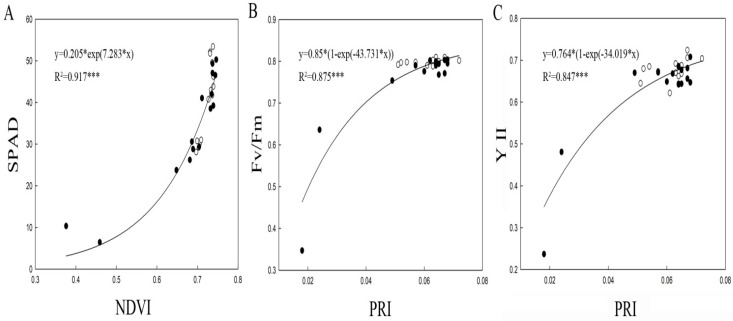
Figure 3.
The regression correlations between (A) SPAD and NDVI, (B) Fv/Fm and PRI, and (C) YII and PRI in plants under control and waterlogging treatments. Each symbol represents the average of ten plants which were randomly selected from each treatment. Each NDVI or PRI index was calculated using leaf SPAD, Fv/Fm, and YII data (n = 30) from the model validation datasets. The R2 coefficients of NDVI and PRI with leaf SPAD, Fv/Fm, and YII were calculated. The white circle represents data from control treatments, whereas the black circle represents data from waterlogging treatments. ***p < 0.001.

