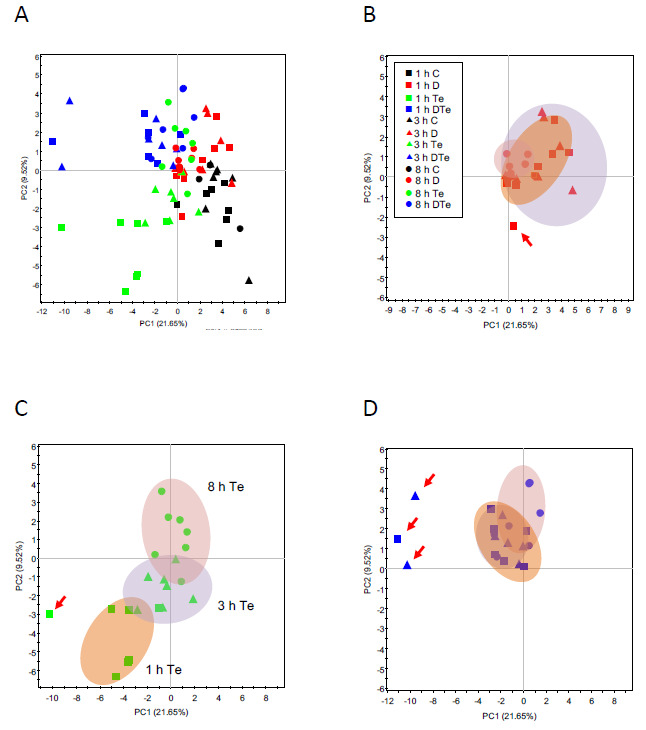
Figure 4.

Principal Component Analysis (PCA) scores plots of PC1 vs. PC2 showing the spatial distribution of plant samples according to non-targeted metabolite profiling and hormonal data: (A) general view including all samples and sample groups, (B) moderate drought-stressed samples, (C) T. evansi-infested samples, and (D) moderate drought-stressed and T. evansi-infested samples. Outlier samples are highlighted with a red arrow. Well-watered control plants—C; uninfested moderate drought-stressed plants—D; infested well-watered plants—Te; and infested moderate drought-stressed plants—DTe.
