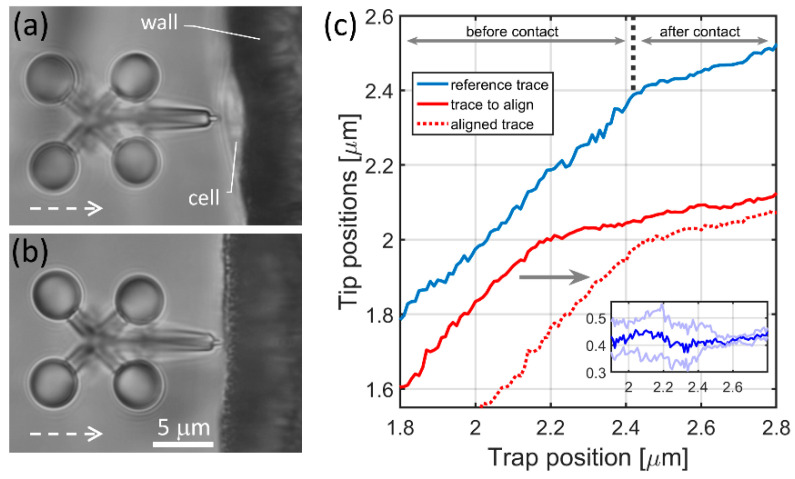
Figure 2.
Cell indentation experiments and the resulted traces of the microtool’s tip. Panels (a,b) show a typical snapshot of the cell indentation and the wall approaching experiments, respectively; the optical axis is perpendicular to the plane of the figure, the white dashed arrows indicate the direction of the microtool movement during the indentation experiment. The tip position was calculated by determining the positions of the four handle spheres on the image series taken during the indentation experiments. (c) shows tip positions from two cell indentation experiments as the function of the trapping beam position (solid blue and solid red traces). It also shows the result of the trace alignment procedure when the red trace is aligned to the blue one with the alignment procedure (dashed red). The inset in (c) shows differences of the red and blue traces during the alignment procedure (see main text).

