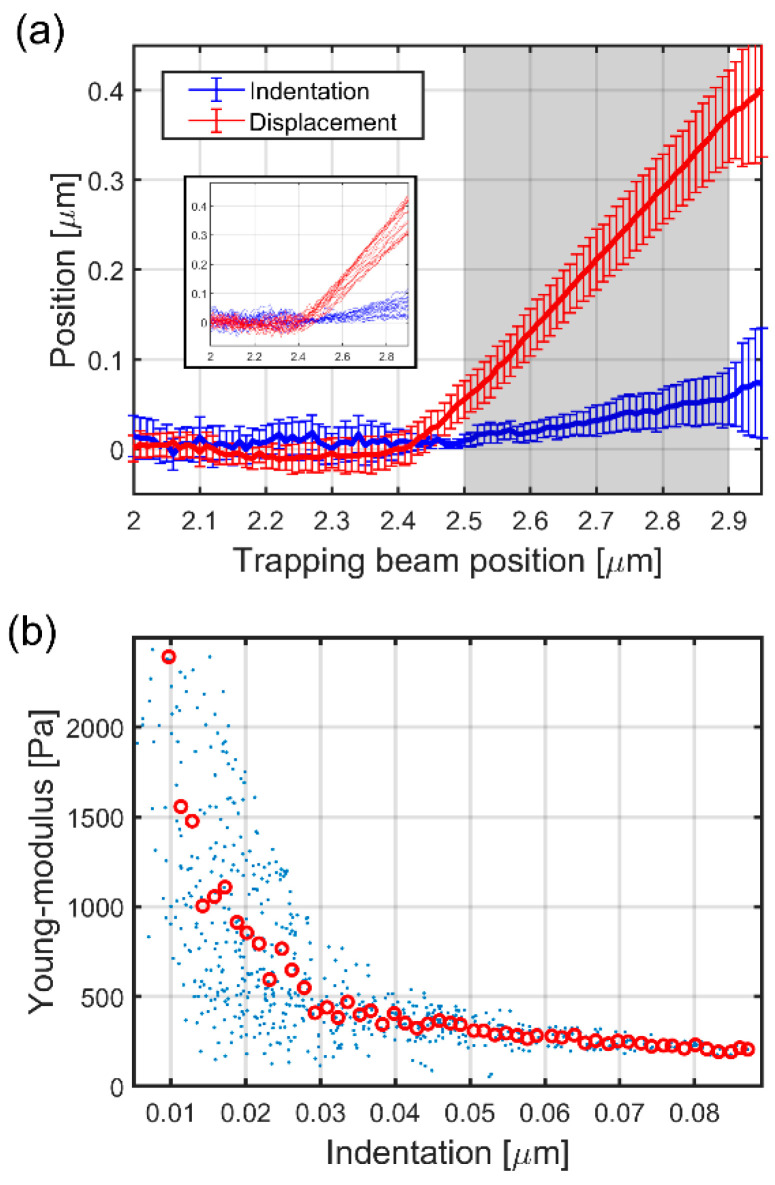
Figure 5.
The measured indentation and displacement data and the Young’s modulus calculated from them. The indentation (blue line) and displacement (red line) data on panel (a) are calculated from the aligned traces of the 19 cell indentation experiments as shown in Figure 4b; the error bars represent standard deviation. The shaded area highlights the reliable range for the two quantities. The inset shows the individual displacement traces (red) and indentation traces (blue) calculated separately for the 19 experiments. The Young’s modulus as the function of indentation over the values highlighted in (a) is shown in panel (b). The blue dots represent all of the approximately 800 individual point pairs (40 trap positions × 19 experiments), while the red circles are their averages in 60 regions over the 0–0.09 μm indentation range.

