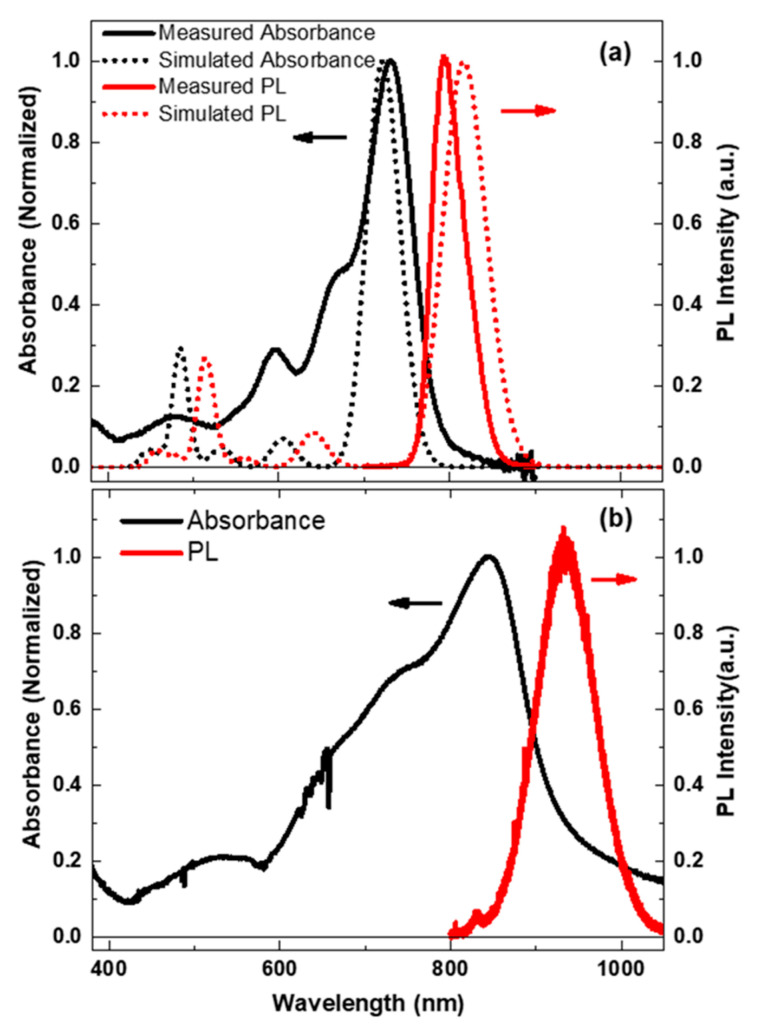
Figure 2.
(a) Experimental measured (solid lines) and simulated (dot lines) absorption and fluorescence spectrum of Y6 in chloroform solution; the simulations were conducted by TD-DFT with B3LYP/6-31G*, and the vibration contribution was not included in the calculation. A Gaussian function with a full width at half-maximum (FWHM) of 0.11 eV was employed for the simulated spectrum. (b) Experimental measured (solid lines) absorption and fluorescence spectrum of Y6 film. The excitation wavelength of experimental measured fluorescence of Y6 solution and Y6 film was 600 nm and 700 nm, respectively.

