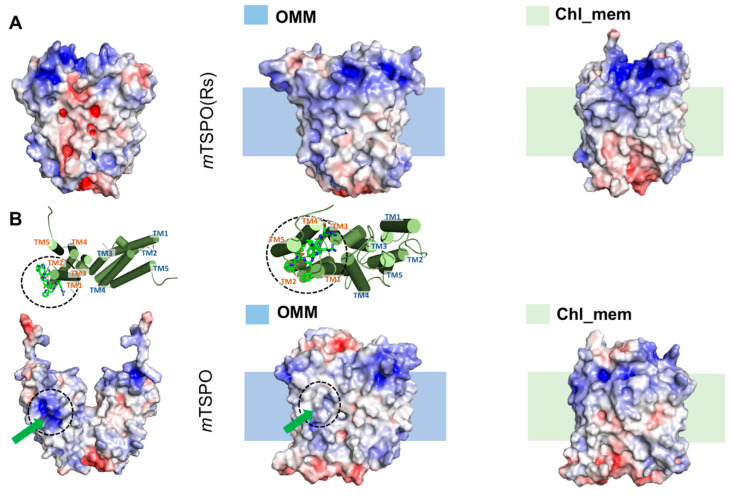
Figure 1.
Electrostatic surface potential of the initial [28] and final molecular dynamics (MD) structures of (A) dimeric mouse TSPO model based on RsTSPO dimer (mTSPO(Rs)) and (B) dimeric mouse TSPO model based on NMR structure (mTSPO), in the different membrane environments simulated here. The initial structure is the one prior to the embedding in the model membranes and it is the first structure of each raw image. The shadow behind the second and the third structures of each column indicate the approximate location of the membrane. The upper part “insert” in B indicates how the exposed polar side-chains in mTSPO twist toward the bulk of the protein after the equilibration. The green arrows indicate the above-mentioned residues in the protein surface. The MD structures were backmapped to all-atom resolution using the backward.py script [31]. The red and blue surfaces represent negative and positive electrostatic potentials, respectively. The maximum values of the potentials are −5 kT/e and +5kT/e, respectively (where k is Boltzmann constant, T is the temperature and e is the electric charge of an electron).

