Figure 2.
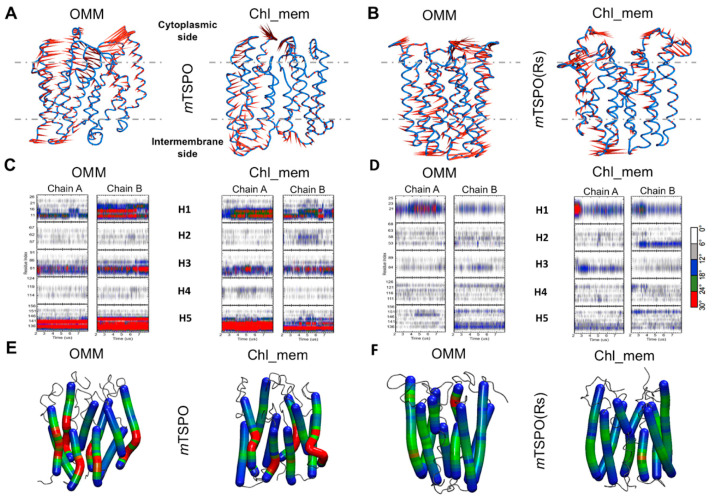
Porcupine plots depicting prominent motions averaged across the first normal mode for (A) mTSPO, (B) mTSPO(Rs) embedded in OMM and cholesterol rich membrane (chl_mem); the corresponding plots for the second normal mode are reported in Figure S4. A dotted line marks the approximate location of the membrane. The helix bending of (C) mTSPO, (D) mTSPO(Rs) in OMM and chl_mem is plotted as a function of the simulation time. The corresponding helix “hinge” regions are also shown on mTSPO (E) and mTSPO(Rs) (F) structures in OMM and chl_mem: the highly bent regions are highlighted in red color, while the least and moderately bent regions are highlighted in blue and green colors, respectively.

